Question
Question: How do you graph and list the amplitude, period, phase shift for \( y = - \sin \left( {x - \pi } \ri...
How do you graph and list the amplitude, period, phase shift for y=−sin(x−π) ?
Solution
Hint : First, using the suitable trigonometric identities, simplify the given equation and try to get a simplest form of the equation so that we can understand it better. Then find the maximum value of the function.
Complete step by step solution:
The given equation is y=−sin(x−π)−−−−−−−−−(1)
This is a trigonometric equation. All trigonometric functions are periodic. This means that the function repeats itself after a regular interval on the Cartesian plane.
The trigonometric function sinx has a period of 2π radians. This means that the values of the function sinx repeat after every interval of 2π radians.
This helps in graphing the curve of a trigonometric function. We can graph the function for an interval of 2π radians and then just replicate the function for every such successive interval.
Let us simplify equation 1 by using the identity −sinθ=sin(−θ) .
Then,
⇒y=−sin(x−π)
⇒y=sin[−(x−π)]
⇒y=sin(π−x)
Now, we shall use the identity sin(π−x)=sinx
So, we get, y=−sin(x−π)=sinx
This means that the graph of equation (1) is the same as the graph of trigonometric function sinx .
So, we get the graph of y=−sin(x−π) as
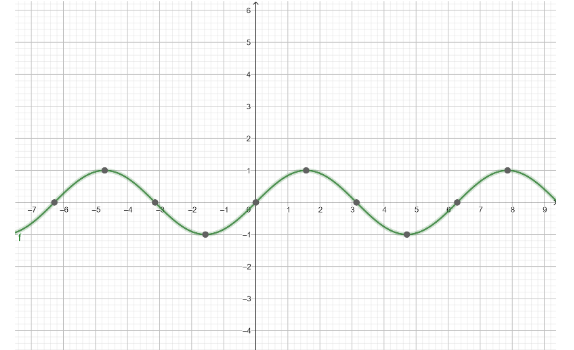
So, we now know that y=−sin(x−π)=sinx
Hence, the maximum value of the function y=−sin(x−π) is 1 .
Therefore, the amplitude of the function y=−sin(x−π) is 1 .
Period of the function y=−sin(x−π) is 2π radians.
Phase shift of the graph is zero.
Note : If we have an equation Asin(kx−ϕ) , then A is the amplitude, k2π is the period and ϕ is the phase shift of the graph.
Here, in this case, A=1 , k=1 and ϕ=0 .
This means that amplitude of the function is 1 , period is 2π and phase shift is zero.