Question
Question: : How do you graph and list the amplitude, period, phase shift for \( y = \sin \left( {\dfrac{{2\pi ...
: How do you graph and list the amplitude, period, phase shift for y=sin(32π(x−21)) ?
Solution
Hint : In order to find the various parts of the function, compare the given sinusoidal function with the general sinusoidal function, comparing all the different parts and obtaining the values for amplitude, period, phase shift.
Complete step-by-step answer :
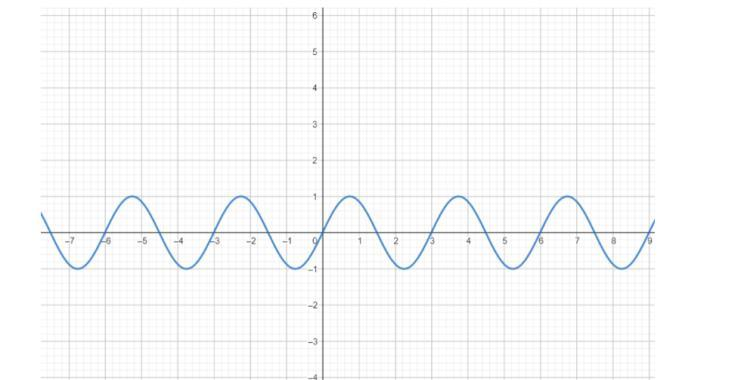
For the normal sine graph, the graph is:
We are given with the function y=sin(32π(x−21)) .
For first part that is graph of the function:
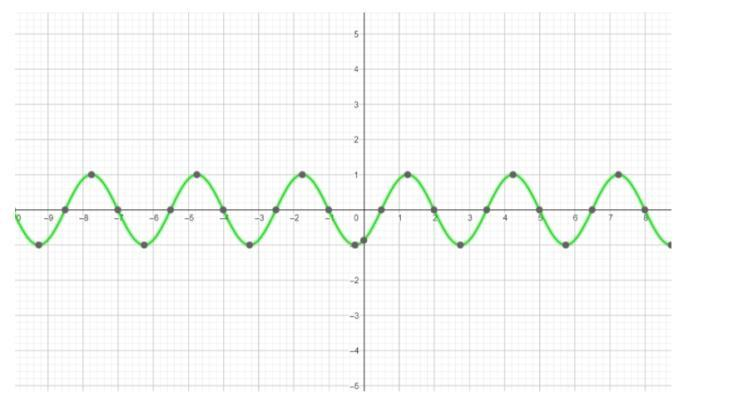
Finding zeros and extrema for the function by solving for x , by comparing the equation under the sine operator with π+k.π for zeroes, 2π+2k.π for local maxima, and 23π+2k.π for local minima. We can set the different integers for the value of k , like −2,−2,0,1,2 .
Then connecting the points to form a continuous smooth curve which will draw a graph.
And, the graph obtained for the function y=sin(32π(x−21)) is:
For second part that is for finding amplitude, period, phase shift:
We can see that the function is sinusoidal. It involves only one single function.
From the general sinusoidal equation, we know that y=a.sin(b(x+c))+d where a,b,c,d are constants. Where a=amplitude of the sine wave, b=2π.Period and c=− phase shift and d= vertical shift or y-coordinate.
Comparing our equation y=sin(32π(x−21)) with the general equation y=a.sin(b(x+c))+d , the constants we get are:
a=1
b=32π
c=−21
d=0
Since, we got the value of a which is our amplitude, so amplitude is 1 .
For period, we know that
b=2π.period =>period=2πb
Substituting the value of b=32π above to get period and it is: period=2πb=2π32π=31 .
And c=− phase shift that implies phase shift =−c=−(−21)=21 .
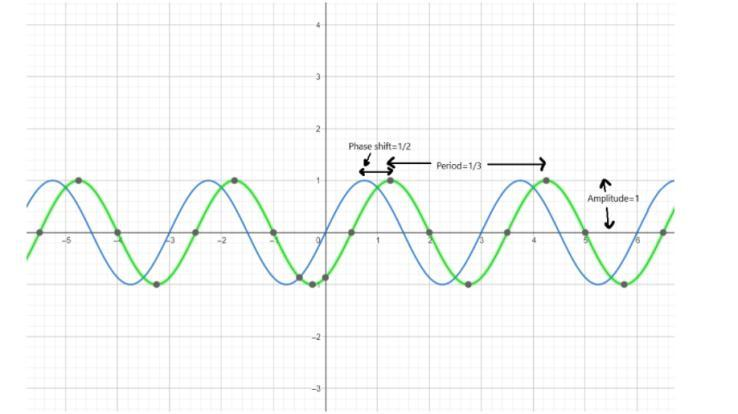
The amplitude, period, and phase shift for y=sin(32π(x−21)) is 1 , 31 and 21 .
Comparing the first and the second graph on the same graph, we get:
Note : Amplitude is the distance between maxima and the axis of oscillation.
We need to ensure that the linear expression inside the sine function has 1 as the coefficient of x . In our above case we saw that the linear expression (x−21) has 1 as the coefficient of x , then moved further to find the rest of the values.