Question
Question: How do you graph and determine if \(y = {\left( {\dfrac{4}{3}} \right)^x}\) is a growth or decay?...
How do you graph and determine if y=(34)x is a growth or decay?
Solution
In the function y=(34)x, base is greater than 1 (as 34>1). So this becomes the graph of exponential function y=ax where a>1.Refer to the standard graph of ax graph for a>1. This is also an increasing function because if we increase the power of any number which is greater than 1, its value increases. It is also a property of y=ax when a>1.
Complete step-by-step solution:
According to the question, we have to draw the graph of a function and determine whether it’s a growth or decay.
The given function is:
⇒y=(34)x
This is an exponential function and its base is 34 which is greater than 1. So we can compare this function with the standard exponential function y=ax when a>1.
We already know the graph of the function y=ax for both the cases, when a>1 and when a<1. This is shown below:
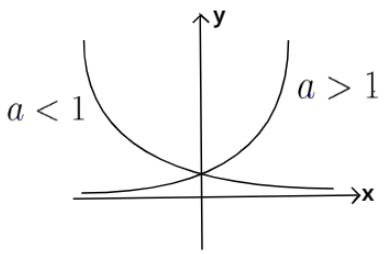
From this, we will only consider the graph of the function where a>1 because the base of our function is greater than 1.
Thus the graph of the function y=(34)x is as shown below:
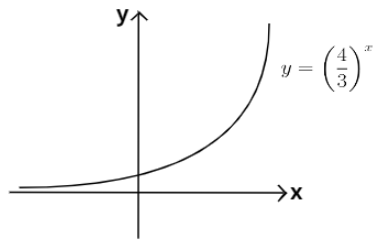
Also this function will be an increasing function because we know that as we increase the power of a number which is greater than 1, its value increases. This is also evident from the graph of the function as the value of y is increasing when the value of x is increasing. Hence this is a growth.
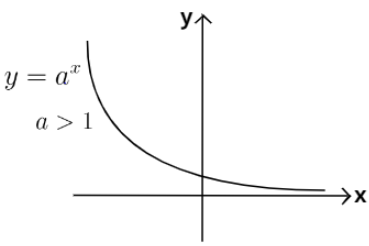
Note: (1) When the base of such function is less than 1 i.e. y=ax when a<1, then such a function will always be a decay or decreasing function because we already know that when we increase the raised power of a number which is less than, its value decreases. This graph is also shown below.
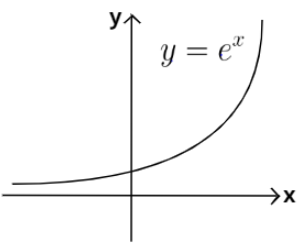
(2) If we replace a in the function y=ax by e, this will become y=ex and its graph will be increasing because e>1.