Question
Question: How do you graph \(-4x+y=2\)?...
How do you graph −4x+y=2?
Solution
To draw the graph of the given equation −4x+y=2. First of all, we are going to put x equal to 0 in this equation and then will see the value of y we are getting. Then we will plot this point where x is 0 and the y corresponding to this x graphically. After that we are going to put y equal to 0 in the above equation and see the values of x we are getting and then plot these x and y coordinates on the graph. Now, we will join these two points to get the straight line.
Complete answer:
The equation of a straight line which we are given is as follows:
−4x+y=2
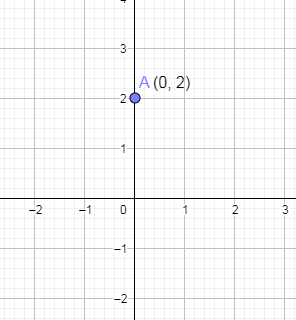
Now, we are going to substitute the value of x equal to 0 in the above equation.
−4(0)+y=2⇒y=2
From the above, we got the point (0,2). Now, we are going to plot this point on the graph paper.
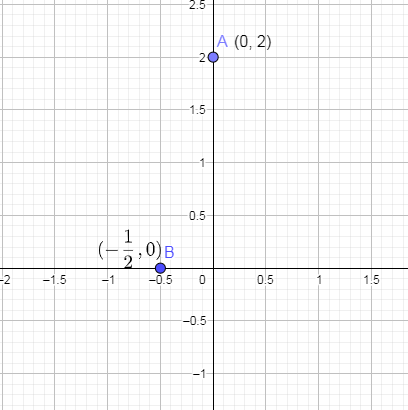
Now, we are going to substitute y equal to 0 in the above equation.
−4x+0=2⇒−4x=2
Dividing -4 on both the sides we get,
x=−42=−21
From the above, the x and y coordinates of the second point are (−21,0) . Let us draw this point (−21,0) on the graph paper and we get,
Now, to draw the equation of a straight line we are going to join these two points A and B and we will get,
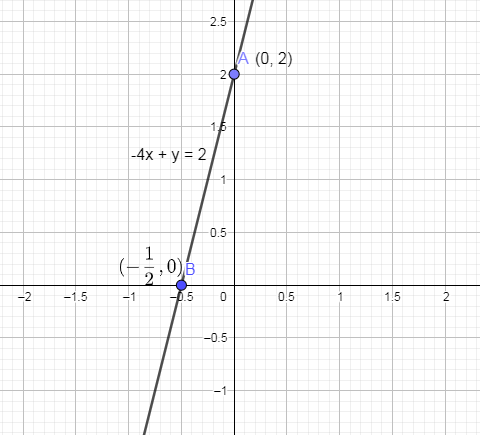
Hence, we have graphically drawn the given equation of a straight line.
Note: We can check the straight line that we drew is correct or not by taking a point on the straight line whose x coordinate is -1 and then to know the y coordinate of that point we are going to draw a perpendicular from this point on to the y axis. The foot of the perpendicular is the coordinate of y axis of that point.
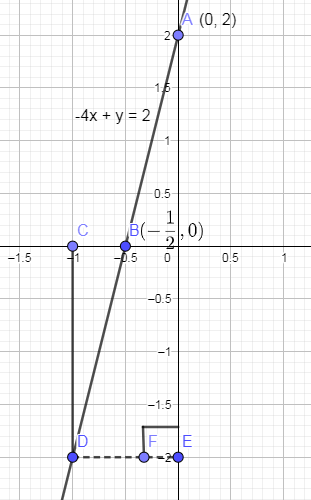
In the above figure, the dotted line segment DE is the perpendicular drawn from point D to y axis and the foot of the perpendicular is -2. Hence, the y coordinate of that point D on the straight line is -2.
Now, we can check whether the y coordinate of point D is -2 or not. Let us substitute the x coordinate as -1 in the above equation we get,
−4(−1)+y=2⇒4+y=2⇒y=−2
From the above, we have got the same value of y which we got from the graph. Hence, the graph that we drew corresponding to the given equation is correct.