Question
Question: How do you graph \(4x + 9y = 27\)?...
How do you graph 4x+9y=27?
Solution
In this question we are supposed to find the graph of the given equation 4x+9y=27. The given equation is linear in order with respect to both variables x and y. To plot the graph of this equation we will first find some point i.e., pairs of x,y such that they satisfy the given equation. Then we will place these points on the X-Y plane.
Complete step by step solution:
In this question we need to plot the graph of equation 4x+9y=27.
To plot this equation we will first find that this equation is of line, circle or some other 2-D shapes. Since our given equation is of linear order in both the variables, so it can be the equation of a line. Because the equation of a straight line is of the form y=mx+c and our equation is 4x+9y=27.
We will modify our equation, so that it will be in the form of an equation of line and find the value of its slope and intercept. To do that we will add −4x to the both side of the equation, to get
4x+9y=27 4x+9y+(−4x)=27+(−4x)
9y=−4x+27 eq(1)
Now, dividing both sides of the equation eq(1), we converted equation 4x+9y=27 in the slope intercept form of a straight line.
99y=−94x+927
y=−94x+3 eq(2)
In our equation we have m=−94 andc=3. Since the given equation 4x+9y=27 is of a straight line.
Now, we will find some point which lies on the given equation by putting the value of x and y respectively in eq(2).
y=−94x+3
Suppose x=0 then value of xineq(1), we get y=3.
Similarly, Suppose x=1 then value of x in eq(1), we get y=−923.
Similarly, Suppose x=2 then value of x in eq(1), we get y=−919.
Similarly, Suppose x=−1 then value of x in eq(1), we get y=931.
Similarly, Suppose x=−2 then value of x in eq(1), we get y=935.Now we have some points which lies on y−8=−x, here is the graph
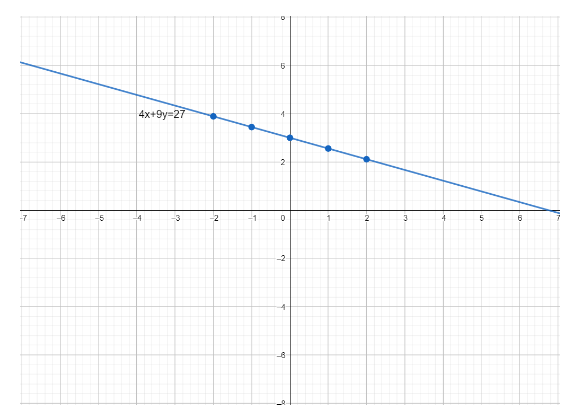
These blue dots on the line are above points which we have used to draw the line.
Note: Questions in which you are asked to draw the graph of an equation you first need to figure out what kind of object this equation resembles. Then find some points which lie on the line. To check whether your graph is correct or not just take any point from the line put in the given equation, if it satisfies then your plotted graph is correct.