Question
Question: How do you graph \(4x - 3y = 6\) ?...
How do you graph 4x−3y=6 ?
Solution
We will first start by evaluating the y-intercept mathematically. We take all the like terms to one side and all the alike terms to the other side. Then we start plotting the graph, first we will mark all the points and then finally plot the graph.
Complete step-by-step solution:
We start with the given equation 4x−3y=6.
Now here we will add 3y to both sides.
4x−3y=6
4x−3y+3y=6+3y
Now we rearrange the terms.
4x=6+3y
Now we will divide both the sides by 3 in order to get the value of y.
Hence, the equation will become.
4x=6+3y
34x=36+3y
Now here, we break the fraction.
34x=36+33y
Now reduce the terms in the equation.
34x=2+y
Now rearrange the terms in order to get this equation into slope point form that is y=mx+c.
So, the equation will become, y=34x−2.
Now if we compare values with our given equation and the slope point form, then we get the values as m=34 and ⇒c=−2
We know that c is the y-intercept. Y-intercept is the point where the graph intersects with the y-axis.so, now we have got one point (0,−2).
Now for the other point we substitute y=0.
y=34x−2
0=34x−2
34x=2
4x=6
x=46
⇒x=23
That is,
⇒x=1.5
So, the other point is (1.5,0)
Therefore, now we have the points, (1.5,0) and (0,−2).
So, now we will plot the graph.
Scale:
X-axis = 1 unit = 0.5 unit
Y-axis = 1 unit = 0.5 unit
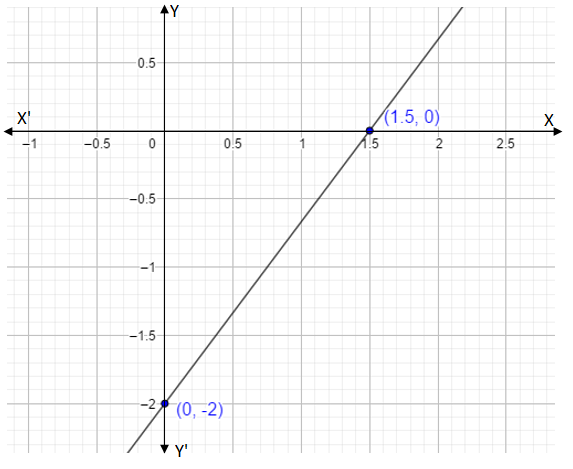
All we did was join the intercept by a straight line and we extended it.
Note: While evaluating the y-intercept, make sure to take all the y-terms to one side and all the other terms to another side. While making a table for the values of x and y make sure you back trace the values to avoid any mistakes. While plotting graphs, always start with the drawing of axes then the points and then join all the points.