Question
Question: How do you graph \(3x + y = - 2\)?...
How do you graph 3x+y=−2?
Solution
First, we have to make the given linear equation in Slope-intercept form and then calculate the value of y for any two arbitrary values of x. Next make a table of these values of x and y. Next plot the obtained points on the graph paper and draw a line passing through these points.
Formula used:
Slope Intercept of a line:
The equation of a line with slope m and making an intercept c on y-axis is y=mx+c.
Complete step by step answer:
Given linear equation in two variables: 3x+y=−2
First, we have to make the given linear equation in Slope-intercept form.
So, subtract 3x from both sides of the equation.
y=−2−3x
Now, we have to calculate the value of y for any two arbitrary values of x. Thus, finding the value of y when x=0 and x=1.
When x=0, y=−2−3⋅0=−2
When x=1, y=−2−3⋅1=−5
Now we have to make a table of these values of x and y.
| x | 0 | 1 |
|---|---|---|
| y | −2 | −5 |
Now we have to plot the points A(0,−2) and B(1,−5) on the graph paper and draw a line passing through A and B.
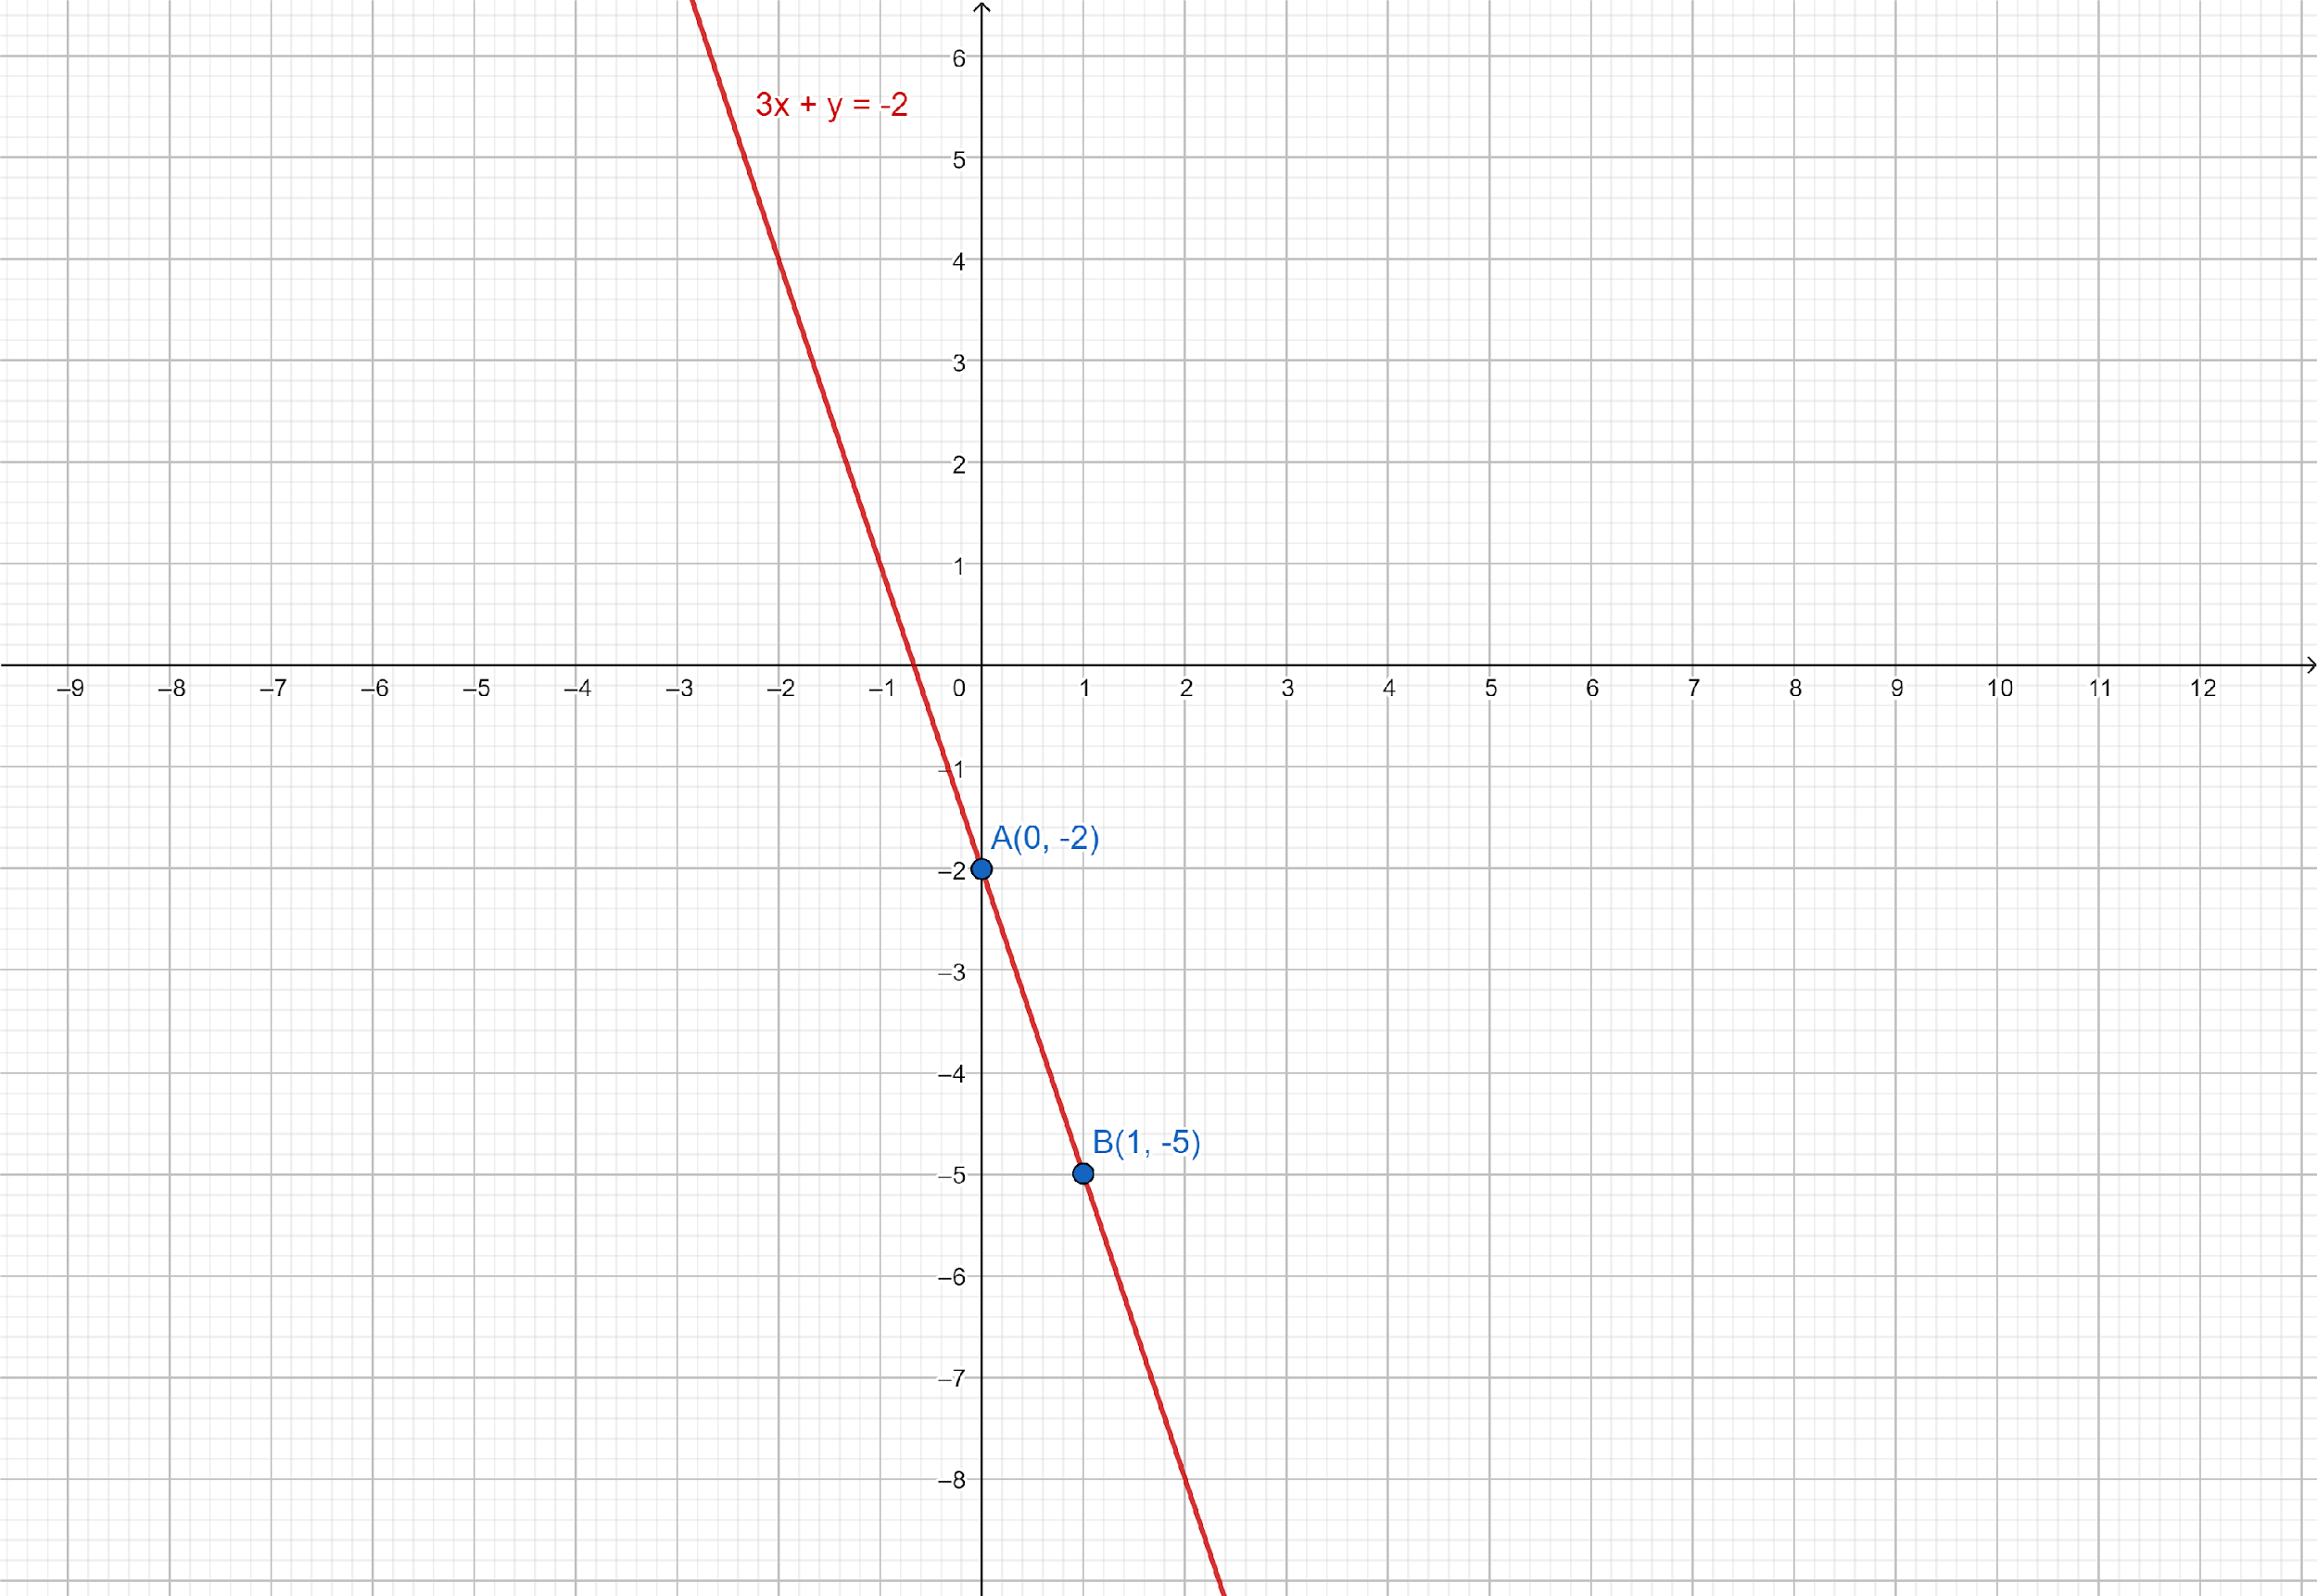
Final solution: Hence, the straight line, so obtained, is the required graph of the given linear equation.
Note: Method to draw the graph of linear equation in two variables:
Step I: Write a given linear equation and express y in terms of x.
Step II: Put different values of x and find the corresponding value of y.
Step III: Form a table by writing the values of y below the corresponding values of x.
Step IV: Plot these points on graph paper.
Step V: Join these points. Thus, we get a straight line and produce it on both sides.
Hence, the straight line, so obtained, is the required graph of the given linear equation.