Question
Question: How do you graph \(3x-y=1\) ?...
How do you graph 3x−y=1 ?
Solution
Try to get the equation in terms of ‘y’ which can be compared to the slope intercept form where we can the slope and ‘y’- intercept. For plotting the graph we need minimum two points which can be obtained by putting ‘x’ and ‘y’ value 0 alternatively in the converted equation.
Complete step by step answer:
At first, we have to get the given equation in terms of ‘y’
3x−y=1
Solving for ‘y’
⇒−y=−3x+1
Multiplying −1 both the sides we get,
⇒(−y)⋅(−1)=(−3x+1)⋅(−1)⇒y=3x−1
Slope intercept form: we can write the equation of straight line in slope intercept form i.e. y=mx+c, where ‘m’ is the slope and ‘c’ is the intercept on ‘y’- axis.
Comparing our equation y=3x−1 with slope point form, we get
Slope m=3 and
‘y’- intercept c=−1
Now for plotting the graph we need at least two points.
For the first point:
Putting x=0 in y=3x−1, we get
y=3×0−1=0−1=−1
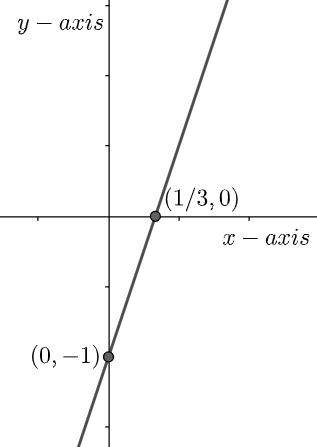
So, the point is (0,−1)
Putting y=0 in y=3x−1, we get
⇒0=3x−1⇒3x=1⇒x=31
So, the point is (31,0)
The graph can be plotted with these two points as
Note: Points obtained by putting the values of ‘x’ and ‘y’ as 0 in the equation y=3x−1, can also be obtained by taking any random values of ‘x’ and ‘y’. These points can also be put in a tabular form which is also a method from where the graph can be plotted. It should be remembered that the two points are not the end points of the straight line. The line only passes through them.