Question
Question: How do you graph \(3x - y < 0\)?...
How do you graph 3x−y<0?
Solution
Given a linear equation and we have to plot a graph of the equation. To plot the graph of the equation, first, we will write the equation for one variable. Then write the corresponding equation by replacing the less than symbol with equal symbol. Then determine the value of one variable y by substituting different values of x. Then the set of these values can be plotted on the set of axes. Then we will join the points to obtain the graph of the equation. Now we will shade the required area according to the symbol.
Complete step-by-step answer:
We are given the equation 3x−y<0. Subtract 3x from both sides of the equation.
3x−y−3x<0−3x
⇒−y<\-3x
Now, divide both sides of the equation by −1 and reverse the inequality symbol.
⇒−1−y>−1−3x
⇒y>3x
Now we will find the corresponding equation by replacing the symbol > with an equal to symbol.
⇒y=3x
Now, we will find the values of y for different values of x. So, create a table to write the different ordered pairs of the equation.
| x | −1 | 0 | 1 |
|---|---|---|---|
| y=3x | −3 | 0 | 3 |
Now, write the intercepts of the equation in the form of ordered pairs.
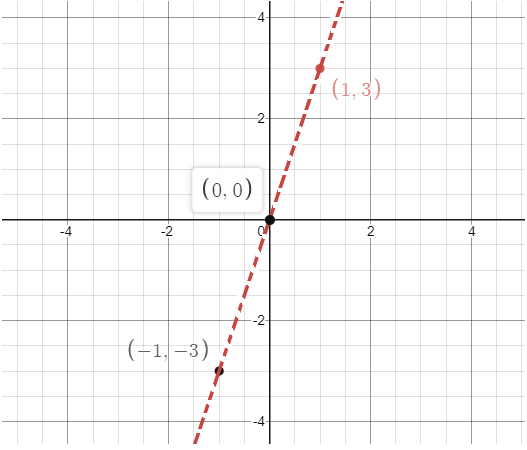
(0,0), (−1,−3) and (1,3)
Now we will plot the points on the set of x-axis and y-axis. Then join these points using a dashed line to show that the points are not included in the graph of inequality because the equation contains symbol >.
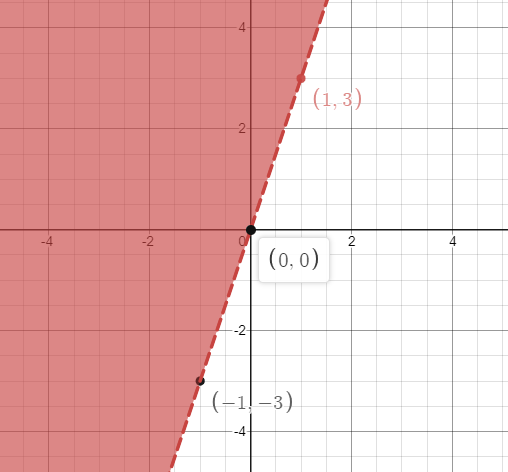
Now, shade the region above the line to represent the inequality y>3x which means the points greater than y=3x are included in the graph.

Final answer: Hence the graph of the equation is
Note:
In such types of questions students mainly make mistakes while plotting the points on the set of axes. In an ordered pair(x,y), the value of x is the distance of the point from y-axis whereas the value of y is plotted by taking the distance from the x-axis. In such types of questions, the graph of a polynomial is obtained by plotting these points and must be in a straight line.