Question
Question: How do you graph \( 3x + 2y = 6 \) by plotting points?...
How do you graph 3x+2y=6 by plotting points?
Solution
Hint : In order to graph the above equation, consider the fact the graph to any linear function of the form ax+by+c=0 is always a straight line ..As to plot a straight line we require two points. One point is the x-intercept obtained by putting y=0 and another is the y-intercept obtained by putting x=0 in the equation. By plotting, these two points and connect them to obtain the straight line of the equation.
Complete step-by-step answer :
We are given a linear equation in two variables xandy i.e. 3x+2y=6
As we know the graph to a linear function of the form ax+by+c=0 is always a straight line.
So, in order to draw a line, we must have at least two points on the graph which we can connect to form a line.
We’ll be taking one point as y-intercept and another as x-intercept .
To calculate y-intercept of the graph, put x=0 in the equation
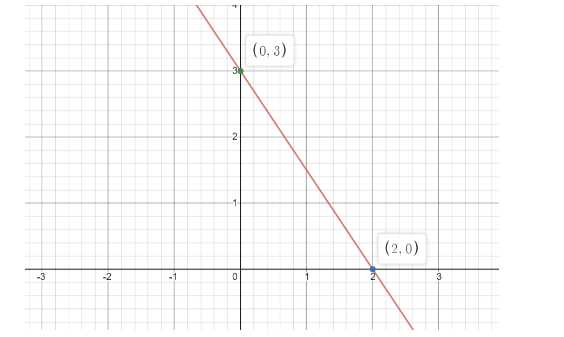
We get y-intercept at point (0,3)
Now To calculate x-intercept of the graph, put y=0 in the equation
We get x-intercept at point (2,0)
| X | 0 | 2 |
|---|---|---|
| y | 3 | 0 |
Now the graph the equation, we are jumping on the cartesian plan and plot (0,3) , (2,0) .Joining these two points we get a straight line representing our equation 3x+2y=6
Graph of equation having y-intercept as (0,3) and x-intercept as (2,0) .
Note : 1.Draw the cartesian plane only with the help of straight ruler and pencil to get the perfect and accurate results.
2.Mark the points carefully.
3. x-intercept is the point at which the line intersects the x-axis of the plane and similarly y-intercept is the point at which line intersects the y-axis of the plane.