Question
Question: How do you graph \(2x + y = - 2\) using intercepts?...
How do you graph 2x+y=−2 using intercepts?
Solution
First find the respective xandy intercepts by substituting the values x=0andy=0 individually in the equation to get yandx intercept of the equation respectively. Then you will get coordinates of two points, plot the points and then join them in order to plot the graph of the given equation.
Complete step by step solution: To plot the graph of a given expression of line, we at least need two of its passing points or a point and a slope. Here in this question we have the equation of the line, and asked to plot the graph using intercepts.
So we will first find the intercepts of the given expression of the line then plot them on the graph and finally join the points to draw the required graph of the equation.
Substituting the value of x=0andy=0 one by one to get intercepts yandx respectively
⇒2x+y=−2 ⇒2×0+y=−2 ⇒y=−2 And ⇒2x+y=−2 ⇒2x+0=−2 ⇒2x=−2 ⇒x=−1
We get the intercepts y=−2andx=−1
Therefore coordinates of the intercepts will be written as
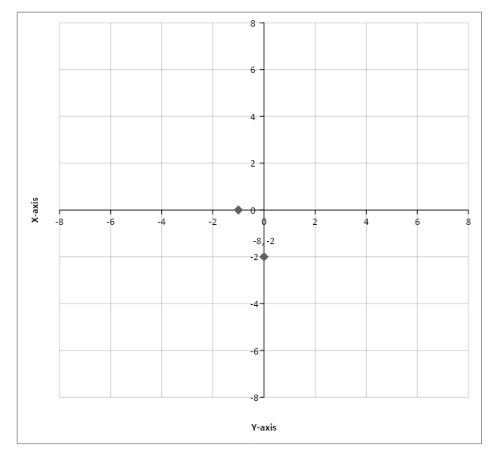
(0,−2)fory intercept and (−1,0)forx intercept
Plotting these two points on the graph
We have plotted the points, now joining and extending both the points in order to get the graph of the line of the equation
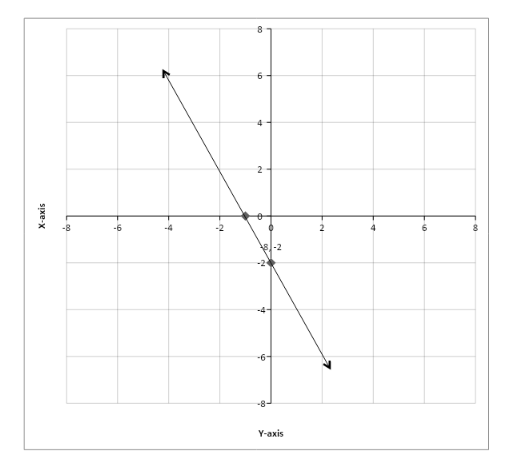
This the required graph of the line of the equation 2x+y=−2
Note: Equations of maximum two variables having degree equals to one always represents a line. Intercepts are the lengths from origin where the graph cuts the axes. We can also find the slope of a line if its xandy intercepts are given as aandb respectively then slope will be given as a−b