Question
Question: How do you graph \[2x + 4y = - 4\] by plotting points?...
How do you graph 2x+4y=−4 by plotting points?
Solution
To solve this we need to give the values of ‘x’ and we can find the values of ‘y’. Otherwise we can find the coordinate of the given equation lying on the line of x- axis, we can find this by substituting the value of ‘y’ is equal to zero (x-intercept). Similarly we can find the coordinate of the equation lying on the line of y- axis, we can find this by substituting the value of ‘x’ equal to zero (y-intercept).
Complete step-by-step solution:
Given, 2x+4y=−4.
To find the x-intercept. That is the value of ‘x’ aty=0. Substituting this in the given equation. We have,
2x+4(0)=−4
2x=−4
Dividing by 2 on both sides,
⇒x=−24
⇒x=−2.
Thus we have a coordinate of the equation which lies on the line of x-axis. The coordinate is (−2,0).
To find the y-intercept. That is the value of ‘y’ at x=0. Substituting this in the given equation we have,
⇒2(0)+4y=−4
⇒4y=−4.
Dividing by 4 on both sides
⇒y=−44
⇒y=−1
Thus we have a coordinate of the equation which lies on the line of y-axis. The coordinate is (0,−1).
Thus we have the coordinate points (−2,0) and (0,−1).
Let’s plot a graph for this coordinates,
We take scale x-axis= 1 unit = 1 units
y-axis= 1 unit = 1 units
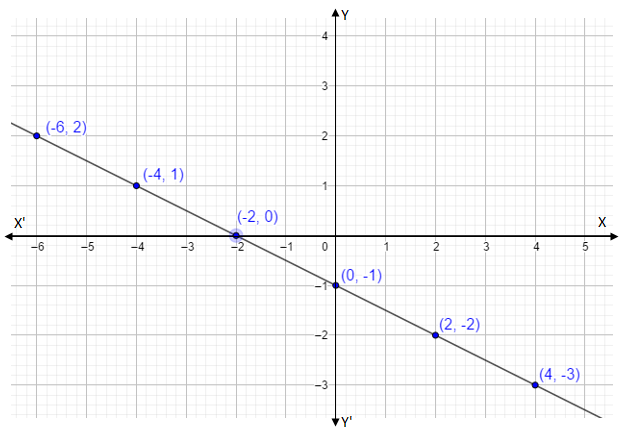
All we did is expand the line touching the coordinate points (−2,0) and (0,−1). by a straight line.
Without calculation we found out the few more coordinate points using the graph. The coordinates are (2,−2),(4,−3)(−4,1) and (−6,2).
Note: The intercept method is an easy method to draw the graph. It will give a more accurate line in the graph. In math, a graph can be defined as a pictorial representation or a diagram that represents data or values in an organized manner. The points on the graph often represented the relationship between two or more things.