Question
Question: How do you graph \(2x+3y=3\) using intercepts?...
How do you graph 2x+3y=3 using intercepts?
Solution
In order to solve this question, we must have prior knowledge about intercepts of a straight-line and how they are represented in the equation of a line. We will find the x-intercept and y-intercept of the given equation of straight. Further, we will plot those on a graph and create the graph of the given function.
Complete step-by-step answer:
The x-intercept is the distance from origin of the point on the given function where the value of y is zero. This point logically lies on the x-axis and is given as (a,0) where a is called the x-intercept.
The y-intercept is the distance from origin of the point on the given function where the value of x is zero. This point logically lies on the y-axis and is given as (0,b) where b is called the y-intercept.
We are given the function, 2x+3y=3.
In order to find the x-intercept, we will put y=0 and solve the equation accordingly. Hence, putting y=0, we get
⇒2x+3(0)=3⇒2x=3
Taking 2 on the right-hand side, we get
⇒x=23
Therefore, the x-intercept is equal to 23.
In order to find the y-intercept, we will put x=0 and solve the equation accordingly. Hence, putting x=0, we get
⇒2(0)+3y=3⇒3y=3
Taking 3 on the right-hand side, we get
⇒y=33
⇒y=1
Therefore, the y-intercept is equal to 1.
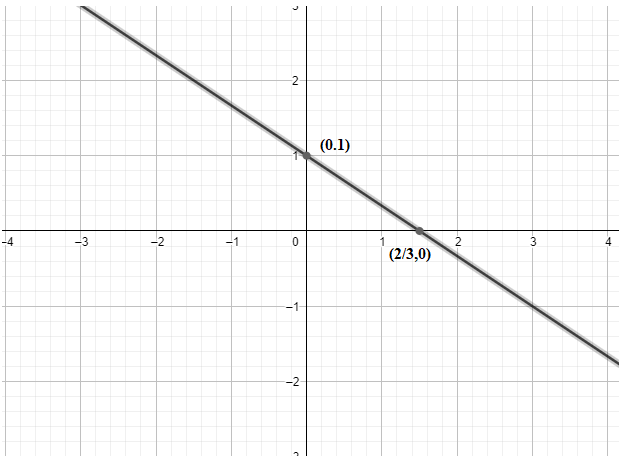
Hence, we get our two points as (23,0) and (0,1).
Therefore, we get our graph as:
Note:
The equation of a straight line is expressed especially in an intercept form which is given as ax+by=1 where a is the x-intercept of line and b is the y-intercept of the line as mentioned before. One essential feature of the intercept form of line is that its constant term is always equal to 1.