Question
Question: How do you graph \[(2,4)\] on a coordinate graph?...
How do you graph (2,4) on a coordinate graph?
Solution
Here, we will use the concept of coordinate plane and quadrants of a coordinate plane. We will observe the given points and find the quadrant in which it will lie. Using this, we will mark the points on the coordinate graph.
Complete step by step solution:
A coordinate plane is a two-dimensional number line where the vertical line is called the y-axis and the horizontal is called the x-axis. These lines are perpendicular and intersect at their zero points. Their intersection point is called the origin and usually denoted as O.
Now, the axes have both positive and negative numbers. The right and the left axes are the +x and the −x axes respectively. The top and the bottom axes are +y and the −y axes respectively.
Any point in the coordinate plane will be denoted as an ordered pair of the point’s distance from the x and y axes respectively. The notation for any point in the coordinate plane is (x,y).
Now, the coordinate plane is divided into four parts called the quadrants.
In quadrant I, both x and y coordinates are positive.
In quadrant II, x coordinate is negative, and y coordinate is positive.
In quadrant III, both x and y coordinates are negative.
In quadrant IV, x coordinate is positive, and y coordinate is negative.
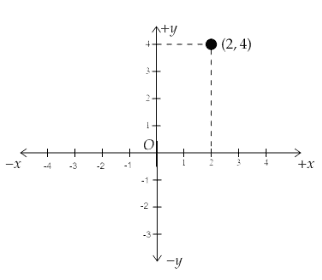
The point given to us is (2,4). Here, the x−coordinate is 2, which is positive and the y−coordinate is 4, which is also positive. So, the point (2,4) lies in quadrant I.
To mark the point (2,4) on the coordinate plane, we will start with the x−coordinate. We will move 2 units right from the origin on the +x axis. Then, from this position, we will move 4 units upward along the +y axis. Hence, we reach point (2,4).
This is illustrated in the graph below:
Note:
We need to keep in mind that when we are plotting points on the coordinate graph, we must start from the origin. At origin both x and y coordinate points are 0 and are represented as (0,0). The x−coordinate says how many units we have to move right (positive) or left (negative). The y−coordinate says how many units we have to move up (positive) or down (negative). We should always begin with the x−coordinate and then plot the y−coordinate.