Question
Question: How do you graph \(16{{x}^{2}}+{{y}^{2}}+32x-18y=119\)...
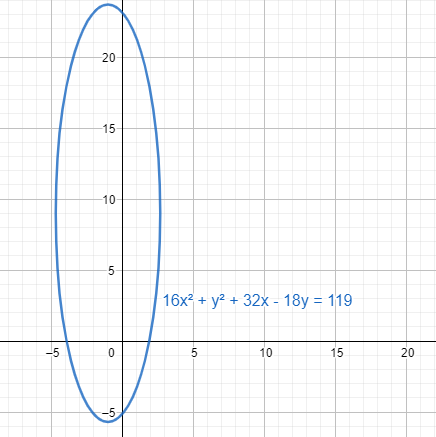
How do you graph 16x2+y2+32x−18y=119
Solution
We equate the given equation of elliptic curve with the general equation of a2(x−α)2+b2(y−β)2=1. We find the number of x intercepts and the value of the y intercept. We also find the coordinates of the focus and the vertices to place the curve in the graph.
Complete step-by-step solution:
The given equation 16x2+y2+32x−18y=119 is an elliptic curve.
We convert the equation into a square form and get
16x2+y2+32x−18y=119⇒(4x+4)2+(y−9)2=216=(66)2⇒(236)2(x+1)2+(66)2(y−9)2=1
We equate (236)2(x+1)2+(66)2(y−9)2=1 with the general equation of parabola a2(x−α)2+b2(y−β)2=1. We can also see that b2>a2. The formula changes if b2<a2.
For the general equation (α,β) is the centre. The vertices are (α,β±a). The coordinates of the foci are (α,β±be). Here e=1−b2a2 is the eccentricity.
This gives the centre as (−1,9). The vertices are (−1,9±236).
Here e=1−161=415 is the eccentricity value.
The coordinates of the foci are (−1,9±925).
We first find the Y-axis intercepts. In that case for the Y-axis, we have to take the coordinate values of x as 0. Putting the value of x=0 in the equation 16x2+y2+32x−18y=119, we get
y2−18y−119=0⇒y=2×118±182−4×(−119)×1=218±800=9±102
So, the intercept point for Y-axis is (0,9±102).
We find the X-axis intercepts. In that case for X-axis, we have to take the coordinate values of y as 0. Putting the value of y=0 in the equation 16x2+y2+32x−18y=119, we get