Question
Question: How do you graph \(15y=3\)?...
How do you graph 15y=3?
Solution
We can simply choose some values of x and find the value of the other variable y for these values of x. Then plot these points on the Cartesian plane to draw the graph. Choose any 2 values of x and find the values of y for those.
Complete step by step answer:
The easiest graph to plot is the graph of a line from the given equation of line.
The can write the given equation as 15y−3=0 …. (i)
We can see that the given equation is in the general form of the equation of a straight line.
I.e. ax+by+c=0, where a, b and c are real numbers.
Therefore, we have confirmed that the given equation is an equation of a straight line. By geometry we know that we need just 2 points that lie on the line to plot the line.
Therefore, let us choose any 2 real values of x and substitute them in equation (i).
In this case, the value of a is equal to zero.
We can equation (i) by 3 and we get that 5y−1=0
Then,
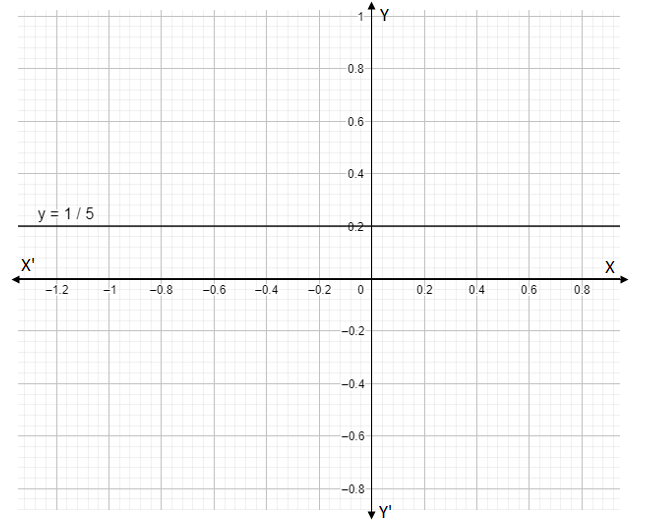
⇒y=51
This means that for any real value of x, the value of y is y=51.
When we plot this line, we will get a vertical line passing through the points, which y-coordinate equal to 51.
Scale: X-axis = 1 unit = 0.2 unit
Y-axis = 1 unit =0.2 units
Note: Note that the method of table of values works with an equation of a straight line only. Since a straight line has constant slope we can just find some points and draw the line.
However, other functions with variable slope need much analysis then just some points. We have to check how the function behaves in some intervals. This can be done using continuity and differentiation.