Question
Question: How do you graph \(0.25x+3y>19\) on the coordinate plane?...
How do you graph 0.25x+3y>19 on the coordinate plane?
Solution
To graph 0.25x+3y>19 on the coordinate plane, this we have to find the boundary line for the inequality by replacing the greater than sign by an equal to sign.
Then we have to find the values of y for different values of x. We will then plot the graph accordingly and shade the portion above the border line.
Complete step-by-step answer:
We have to graph 0.25x+3y>19 on the coordinate plane. For this we have to find the boundary line for the inequality. We can do this by considering the inequality as an equation by replacing the greater than sign by an equal to sign.
⇒0.25x+3y=19...(i)
Now, we have to find the values of y for different values of x.
Let us consider x=4 . We have to value y when x=4 by substituting this value of x in equation (i).
⇒(0.25×4)+3y=19
Let us solve this equation.
⇒1+3y=19⇒3y=19−1⇒3y=18⇒y=318=6
Similarly, let us find the value of y when x=16 .
⇒(0.25×16)+3y=19
Let us solve this equation.
⇒4+3y=19⇒3y=19−4⇒3y=15⇒y=315=5
Now, let us consider x=64 .
⇒(0.25×64)+3y=19⇒16+3y=19⇒3y=19−16⇒3y=3⇒y=33=1
Let us tabulate these so that we can draw the graph easily.
| x | y |
|---|---|
| 4 | 6 |
| 16 | 5 |
| 64 | 1 |
Now, let us plot these points in the Cartesian plane.
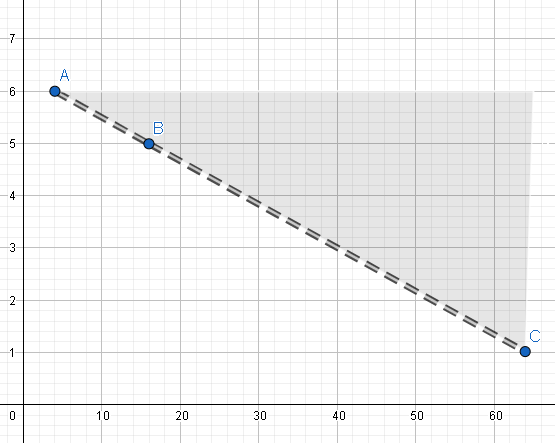
We will show the boundary line as dotted as the given inequality does not contain an ‘equal’ to sign. The shaded portion represents the ‘>’ sign in the inequality. We shaded the upper portion because of the ‘>’ sign.
Note: Whenever we get an inequality to be shown graphically, then we should also replace the sign to an ‘=’ sign. When we get an equation with a ‘>’ sign, we will shade the top part or right side of the border line provide the border line will be dotted. When we get an equation with a ‘<’ sign, we will shade the bottom part or left side of the border line provide the border line will be dotted. When we get an ‘=’ sign along with any equality, we will draw the border line (it will not be dotted) along with the rule of > or < sign.