Question
Question: How do you find the x and y intercepts for \(3y = 18\)?...
How do you find the x and y intercepts for 3y=18?
Solution
In this question, we need to find the x and y intercepts for the given equation. Note that the given equation is an equation of a straight line. Firstly, we find the x-intercept if it exists. Then we find the y-intercept. To find this we solve the equation for the variable y. Then from the obtained points we plot a graph of the given equation in the x-y plane.
Complete step by step answer:
Given an equation of the form 3y=18 …… (1)
We are asked to determine the x and y intercepts for the above equation given by the equation (1).
Note that the given equation is one of the equations of a straight line. We know this fact because the term y in the equation has a power 1 (so it is not squared or square rooted terms).
We can simplify the given equation, so that our calculation becomes easier.
We find the points of intercepts and then draw a line through them to understand the given problem properly.
Finding the y -intercept :
To find this, we solve the given equation for the variable y.
We have from equation (1), 3y=18
Dividing the both sides of the equation by 3, we get,
⇒33y=318
Cancelling the common terms and simplifying, we get,
⇒y=6
Hence the whole line y=6 has a y-intercept of 6.
Finding the x -intercept :
Note that there is no x term in the given equation. So we cannot set x equal to zero.
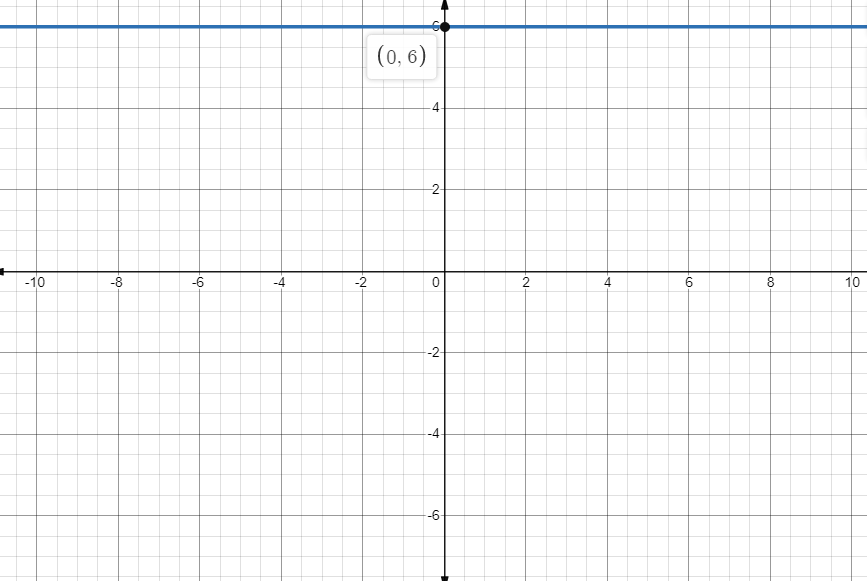
So the given equation does not have x-intercept. We plot the graph and we observe that the line is parallel to x-axis.
Hence the given equation 3y=18 has a y-intercept 6 and this line has no x-intercept.
Now we plot the graph to understand the given problem.
Note that the graph is a straight line and parallel to x-axis.
Note: Students must remember that to obtain the x-intercept, we set the value of y equal to zero and find the point. Then, to obtain the y-intercept, we set the value of x equal to zero and find the point. Then from obtained (x,y) points we plot a graph of the given equation in the x-y plane.
Linear graphs have many applications. In our day-to-day life, we observe variation in the value of different quantities depending upon the variation in values of other quantities.
For example, if the number of persons visiting a cloth shop increases, then the earning of the shop also increases and vice versa.
Another example, if a number of people are employed, then the time taken to accomplish a job decreases.
We generally represent this with the help of linear graphs.