Question
Question: How do you find the slope and the y-intercept for the line \[5x - y + 2 = 0\]?...
How do you find the slope and the y-intercept for the line 5x−y+2=0?
Solution
Here in this question, we have to plot the graph for the equation using the slope and the intercept. By substituting the x is equal to zero we can find the y intercept value and substituting y is equal to zero we can find the x intercept value. By equating the given equation to the general equation of line we can determine the slope.
Complete step-by-step solution:
The given equation must be written in the form of y=mx+b, where m is slope and b is known as y-intercept. Slope means ratio of vertical change to the horizontal change i.e., ratio of change in y-axis or step size of y-axis to the change in x-axis or step size of x-axis. An intercept is a point where the straight line or a curve intersects the y-axis in a plane. If the point x is zero then the obtained point is a y -intercept.
Now consider the given equation 5x−y+2=0
This can be written as y=5x+2-------(1)
Substitute the value of x as 0 in equation (1), then we have
⇒y=5(0)+2
On simplifying we get
⇒y=2
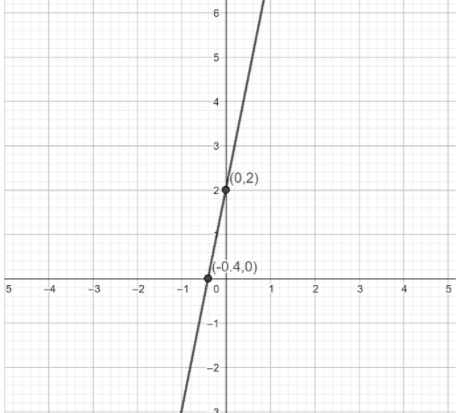
Therefore, y-intercept is (0, 2)
Substitute the value of y as 0 in the equation (1) then we have
⇒0=5x+2
On simplifying we get
Therefore, x-intercept is (-0.4, 0)
The general equation of a line is given by y=mx+b, the b is the y-intercept and it is 2. On substituting we get y=mx+2 ------ (2)
On comparing the equation (1) and equation (2) we get
m=5
Therefore, the slope is 5
The graph for this is given below
Note: The question is belonging to the concept of graph. By comparing the given equation to the equation of a line we calculate the slope and intercept. Or by choosing the value of x we can determine the value of y and then plotting the graphs for these points we obtain the result.