Question
Question: How do you find the period, amplitude and sketch \[y = \sin \left( {x - \pi } \right)\] ?...
How do you find the period, amplitude and sketch y=sin(x−π) ?
Solution
Hint : Here in this question, we have to find the period, amplitude and graph of given sine function. Use the form asin(bx−c)+d to Find the amplitude = ∣a∣ , then Find the period using the formula ∣b∣2π and draw a sketch or graph for the co-ordinates (x,y) by the giving the x value as 0 , 2π , π , 23π ….., we can easily find the value of y by using the given expression.
Complete step-by-step answer :
Let's use the form of equation i.e., asin(bx−c)+d to find the variables used to find the amplitude, and period.
Now consider the given expression y=sin(x−π)
Where,
a=1
b=1
c=π
d=0
The Amplitude is the height from the centre line to the peak (or to the trough). Or we can measure the height from highest to lowest points and divide that by 2.
To Find the amplitude = ∣a∣ .
⇒ Amplitude =∣a∣=1
Period is the complete revolution of a wave completing crest and followed by trough. So, for this sine function, the period is 2π .
Because, it becomes zero at first x=π , and then completing one crest becomes zero at x=2π . And, then completing one trough becomes zero x=3π . So, it has completed one revolution, the difference in x on both sides is 2π . Hence, the period is. 2π
Otherwise
The Period goes from one peak to the next (or from any point to the next matching point):
Find the period using the formula ∣b∣2π
⇒ Period =∣b∣2π=∣1∣2π=2π
Sketch or graph we can draw by using the coordinates
For coordinates, giving the x values 0 , 2π , π , 23π … simultaneously to the given equation to get the values of y
| x | 0 | 2π | π | 23π | 2π | 25π |
|---|---|---|---|---|---|---|
| y=sin(x−π) | 0 | 1 | 0 | 1 | 0 | −1 |
| (x,y) | (0,0) | (2π,−1) | (π,0) | (23π,1) | (2π,0) | (25π,−1) |
The sketch of the given function y=sin(x−π) is:
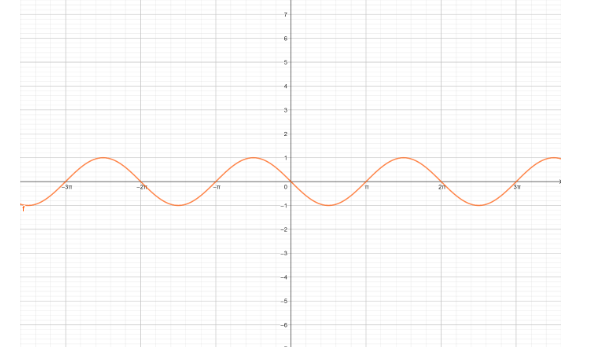
Note : The period is the length of the smallest interval that contains exactly one copy of the repeating pattern. The Amplitude is the height from the centre line to the peak. We use the form of equation i.e., asin(bx−c)+d and we have formula for the period and amplitude and hence we determine the values.