Question
Question: How do you find the domain and range of the piecewise function: \(y = {x^2}{\text{ if }}x < 0,y = x ...
How do you find the domain and range of the piecewise function: y=x2 if x<0,y=x+2 if 0⩽x⩽3,y=4 if x>3
Solution
Here we can proceed by plotting the graphs of each if the three curves that are given and then we can easily find the values of x for which the value of y exists and those values of x will come under the domain and the values of y belong to the range.
Complete step by step solution:
Here we are given the function according to which we are given:
y=x2 if x<0,y=x+2 if 0⩽x⩽3,y=4 if x>3
So we have three curves and we need to find their domain and range as a piecewise function.
So let us first plot the graph of these three curves on the graph and we will get the graph as:
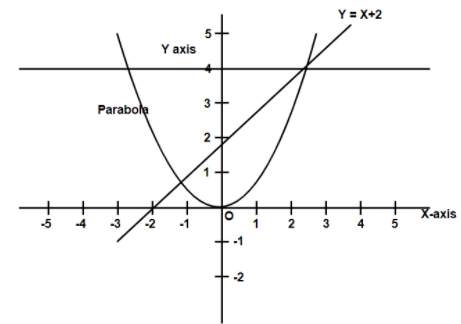
Now this is the general graph of the curves given but we need to now plot the curves according to the values of the specified region and we will get:
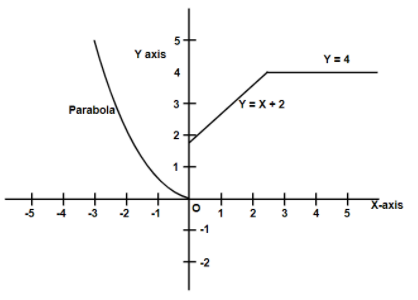
Here y=x2 if x<0 represents the parabola which is an upward parabola with the x<0
Here y=x+2 if 0⩽x⩽3 represents the line with its domain between 0 and 3
Here y=4 if x>3 is also the straight line parallel to x−axis and passing through y=4
So from the graphs of all in one plotting we can see that for all the values of x there exists the value of y
Hence all the numbers on the x-axis are under the domain of this piecewise function.
So we can say that domain=(−∞,∞)
Now when we need to find the range we need to see the values of y that exist there any value of domain in the graph.
So from the graph it is very clear that values of y exist only on the positive y-axis as for the negative y-axis no graph is there whose value can be there.
So we can say that Range=(0,∞)
Note:
Here whenever the student is asked to find the domain and range of any piecewise function, he must always plot the graph for convenience so that he can easily see from the graph also the domain and range of that piecewise function.