Question
Question: How do you find the axis of symmetry, graph and find the maximum and minimum value of the function \...
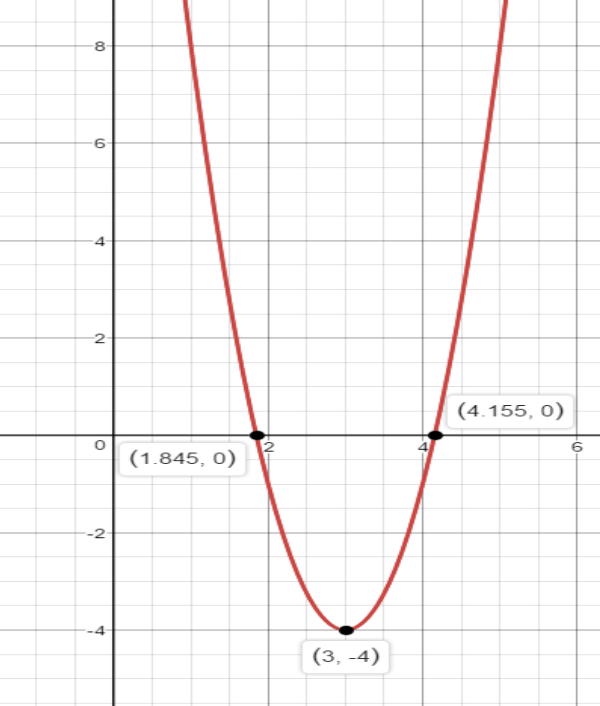
How do you find the axis of symmetry, graph and find the maximum and minimum value of the function y=3(x−3)2−4 ?
Solution
Use the standard parabola of the form y=a(x+h)2−k to graph the function using standard input-output values of x,y respectively. Then the obtained graph will give us a pictorial idea of the axis of symmetry, maximum and minimum values.
Complete step-by-step solution:
The function here given to us is in the vertex form. This makes finding max and min value, the axis of symmetry, and graphing exponentially easier.
The maximum or minimum value is simply the k value in vertex form. In this case, the minimum value is −4.
As the parabola opens up and hence it is minimum.
The axis of symmetry is just the x value of the vertex. It is also an equation. In this case, the vertex is(3,−4).
Therefore, the axis of symmetry is x=3 .
Lastly, graphing the parabola is made easier in vertex form, because you're given the vertex it's right there, and you know the avalue implies you know how much the parabola is going to stretch.
The easiest way to graph a function and a parabola is to use the input-output method. Input is the x-axis, while output is the y -axis. You are always looking for the y-axis (with this method), and the input is always 1 number higher or lower than the vertex. You continue to increase the x -value by 1
Additional information: The parabola is symmetric about its axis, moving farther from the axis as the curve recedes in the direction away from its vertex. For a parabola whose axis is the x axis and with the vertex at the origin the equation is y2=2px, in which p is the distance between the directrix and the focus.
Note: It is very important that we know the basic way of graphing a function where we give the input values as xvalues and get the output values as yvalues. The idea of graphing can also be done with the basic transformation properties of graphing.