Question
Question: How do you draw the graph of \[y=2x-6\]?...
How do you draw the graph of y=2x−6?
Solution
For drawing the graph of a linear equation, we just need to plot two points satisfying the given linear equation. This can be done by randomly selecting 2 values for x and find the values of y corresponding to the selected values of x.
Complete step by step solution:
To draw the graph of y=2x−6, we need to find the points which lie on y=2x−6.
In the graph of y=2x−6 :
On putting, x=0,
We get, y=2(0)−6=(−6).
Therefore, the point (0,−6) will lie on the graph.
Now, on putting, y=0 ,
We get, 0=2x−6⇒x=3.
Therefore, the point (3,0) will lie on the graph.
From the above calculations, we found that the graph will include (3,0) and (0,−6).
Now, let’s plot these points in the graph:
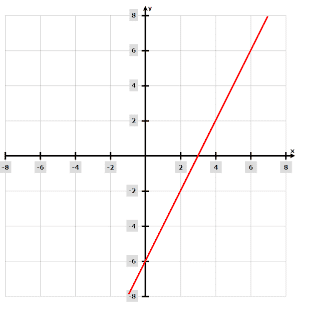
Note:
While solving such questions, it is recommended to select points for which one of the coordinates is 0. This will help in simplifying the calculations. Graph of a linear equation is a straight line, therefore, finding only 2 points is sufficient.