Question
Question: How do you draw the graph of equation \[4x-7\]?...
How do you draw the graph of equation 4x−7?
Solution
To draw a graph of the term of type ax + b, first, we will equate the term ax + b to y, that is ax + b = y. Then, we will try to find the coordinates of the points from which the equation ax + b = y is passing. To find the coordinates of the point, first put x = 0 in the equation and then find y and write it in form of A(x1,y1) , and after that, put y = 0 and then find x and write it in the form of B(x2,y2). By doing so, we will get the two points to draw the line.
Complete step-by-step solution:
It is given in the question that we have to graph 4x - 7.
Now, we know that to draw a graph of the term of type ax + b, first, we will equate the term ax + b to y, that is ax + b = y.
Therefore, for a = 4; b = -7, we get the equation as
4x – 7 = y
Now, we will try to find the points on the equation 4x−7=y by putting x = 0.
⇒4(0)−7=y
And on further simplifications, we get
⇒y=4(0)−7
⇒y=0−7
⇒y=−7
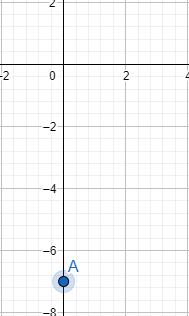
So, we get the coordinates of the one point as (0, -7). Let us call this point A.
Let us locate it on the graph.
Now, we will put y = 0 in the equation 4x – 7 = y.
⇒4x−7=0
And on further simplifications, we get
⇒4x=7
⇒x=47
⇒x=1.75
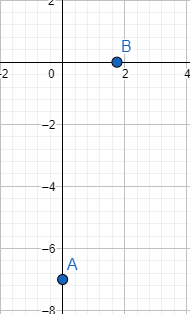
So, the coordinates of the point are (1.75,0). Let us call this point B. Let us locate it on the graph.
Now, we have to connect the points to draw the graph
Let us locate the line which is passing through both the points.
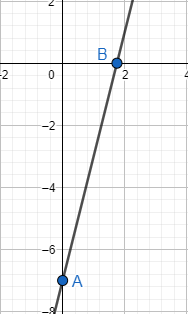
Hence, we have found the line of 4x – 7 = y.
Note: We should not make mistakes in the calculation part because on doing one mistake the wrong graph will be drawn. We can always calculate the slope(m) to check the validity of the graph. Be careful while putting the coordinates value in the graph as sometimes students make mistakes by putting the x-coordinate on y-axis.