Question
Question: How do you draw the graph for \[y=-cotx\] for \[0\le x\le 2\pi \] ?...
How do you draw the graph for y=−cotx for 0≤x≤2π ?
Solution
First of all, we will see in which quadrant value of cotangent is positive and in which quadrant, it is negative. Then we can just reverse the quadrants for −cot x to check where positive values lie and where negative. Then we will plot the x-y graph, where the x-axis will represent the angle in radians while the y-axis will denote the value of the function. The value of x lies between 0 and 2π so the x-quadrant will contain an angle between them. The range of the function is cotx<−1 or cotx>1.
Then −cotx>1 or −cotx <−1. This implies y>1 or y<1.
Complete step by step solution:
We have to plot the graph of −cot x
For this we should have the value of cot x in the given domain [0,2π].
We know that cot gives positive values in the first and fourth quadrant and negative values in the second and third quadrant.
So, -cot will give negative values in the first and fourth quadrant and positive values in the second and third quadrant.
The cycle changes after π radians. So, there is one cycle between 0 and π, another between π and 2π and so on.
Every cycle has vertical asymptotes at the end of the cycle.
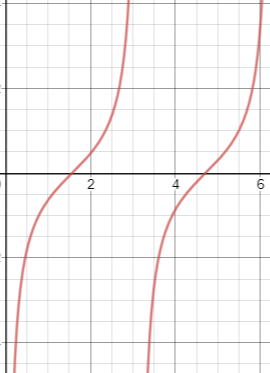
The value of cot in each cycle is decreasing so −cot x will have increasing values in each cycle.
So , keeping all these points in mind , we plot the following graph:
Note:
The asymptotes of cot x are the x-intercepts of the function tan x. While the asymptotes of tan x is the x-intercept of the function cot x.