Question
Question: How do you determine the slope of \[x = - 5\] \[?\]...
How do you determine the slope of x=−5 ?
Solution
We need to know how to plot a point (x,y) in the graph sheet. Also, we need to know horizontal changes and vertical changes in the plotted graph. If y the value is not given, we can take y it as ....−2,−1,0,1,2,.... . But, the value of x is n't varied for any of the y values. We need to know the definition of slope in the graph.
Complete step by step solution:
We have to find the slope of x=−5 . Here the value y is not given, so we can assume y as any whole number.
In this question we assume y is equal to 0 . So we have the point (x,y) as (−5,0) . To find the slope of the given equation we have to plot the point (−5,0) in the graph.
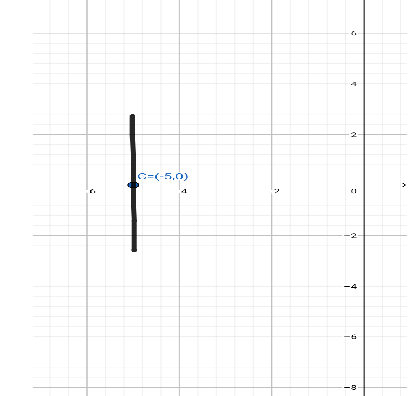
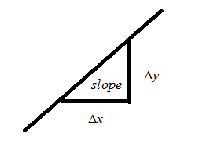
From the graph we can see the given point (−5,0) , is made a vertical line. Before finding the slope of the line, we need to know the definition of the slope. The slope is defined as the ratio between vertical changes and horizontal changes. Here vertical changes involved with the direction of y the axis and the horizontal changes involved with the direction of x the axis.
So, we get
slope=ΔxΔy
Here, Δy is vertical changes and Δx is horizontal changes.
From the graph, we can see the vertical changes but we can’t see the horizontal changes, that is the value of x it doesn’t vary. So, we can’t find the value of the slope.
So, the final answer is,
The slope x=−5 is undefined.
Note: We assume y=0 for making the (x,y) format point. By making these changes we can easily plot the point in the graph sheet. Also, we can assume y=1,y=2,y=−1,y=−2,etc . Note that the slope can be defined as when both horizontal changes and vertical changes occur in the graph. Otherwise, we cannot find the slope from the graph.