Question
Question: How do you calculate work from a \( PV \) diagram?...
How do you calculate work from a PV diagram?
Solution
Hint : A PV diagram, also known as pressure-volume diagram is normally used for letting us know about the changes that take place in a system, that is change in pressure and volume. It is used for gases. It can visualize the changes of p-v as each point on the diagram indicates a different state of the given gas.
Complete Step By Step Answer:
We know that when gas is subject to various thermodynamic processes, its pressure and volume vary. So a pressure-volume diagram plots, for a process or different processes, the difference in pressure with respect to the volume (change of P wrt V ).
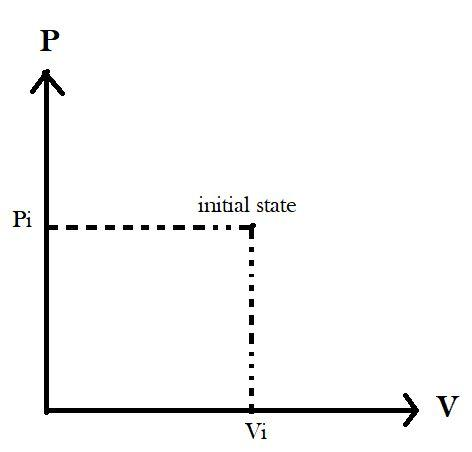
It is important to mark the pressure and volume on the vertical and horizontal axis respectively, as shown in the diagram below. Be careful to remember this, as identifying this is a crucial part of finding the magnitude of work done.
The total work done is calculated by finding the total area under the PV curve.
This is because: W=FΔx=(PA)Δx=P(AΔx)=PΔV
Here we know that PΔV is actually length×breadth=height×width for the given rectangle, this proves that work done is the area under the graph.
For us to find this area for a given curve, we can divide the area under the curve into familiar shapes like rectangles, squares or triangles, and where we know the values like initial and final values of P and V .
So in general we can write the formula as:
Workdone=Areaunderthecurve
Remember that, for any given curve, one can find the area of it by dividing the area into an infinite number of thin rectangles, the sum of areas of each of the rectangles would give the magnitude of total work done. The unit of work is joules ( J ), as it is Pascal×m3 .
To determine the sign of the work done, we have to see the direction of the PV diagram. If it is a path going towards the left, it means that the volume is decreasing but positive work is done to the gas. On the contrary, if the path is directed right, then negative work is being done.
Note :
Ideal gas chemistry is purely theoretical. This is because gases are constantly moving around and the molecules in them collide continuously and so it is not possible to make conclusions for such a gas. But they are given certain rules;
(i) The molecules in an ideal gas are said to not attract or repel. Their interaction is purely elastic.
(ii) They take up no space or have 0 volume. Normal gas moves around and requires space for the molecules to contract and expand but in ideal gas, the molecules will be particles with no volume.