Question
Question: How do we know for sure that only one of the plots pictured as shown could be a correct graph repres...
How do we know for sure that only one of the plots pictured as shown could be a correct graph representing the photoelectric effect for some metal?
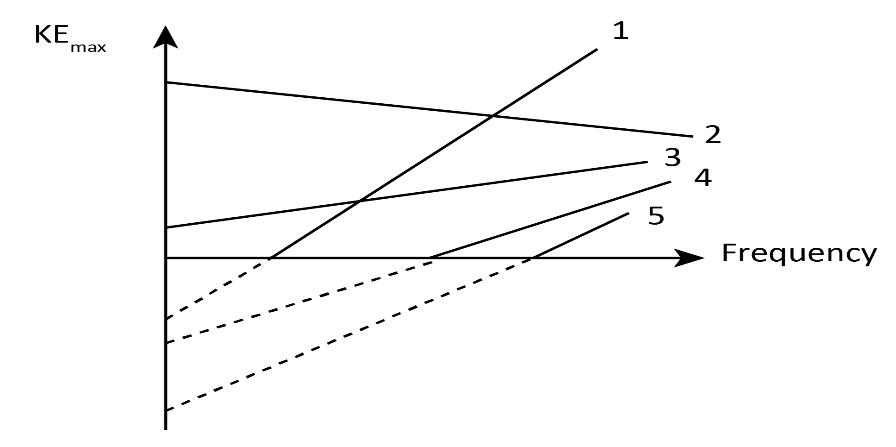
(A) All graphs like this must have the same y-intercept.
(B) All graphs like this must have the same x-intercept.
(C) All graphs like this must have the same slope.
(D) All graphs like this must tilt downward.
(E) More than one of these graphs could correctly represent the photoelectric effect.
Solution
We will obtain a relation between kinetic energy and frequency.
Then, we will try to find the features of the graph that is plotted with kinetic energy against frequency.
Complete step by step answer:
In the photoelectric effect, if a light of a particular frequency falls on a metal surface, electrons will be ejected from the metal surface. The light radiations falling on the metal surface should have a frequency above the threshold frequency of the metal.
As we know, light is composed of photons. Each photon transmits its energy and causes the ejection of an electron. Some part of the energy of the photon is utilised for the ejection of the electron from the metal and the rest is used as the kinetic energy of the electron. The ejected electron moves with a velocity using its kinetic energy. Hence, the energy of a photon is given by,
E=ϕ+KEmax
Here ϕ is the work function of the metal and KE is maximum kinetic energy of the electron.
The work function is the energy necessary for eliminating an electron from a metal.
If υ is the frequency of the light radiation, then we can write
E=hυ
Here h is the Planck’s constant.
Hence, we can write
hυ=ϕ+KEmax KEmax=hυ−ϕ
This equation is in the form of a straight line given by y=mx+c where m is the slope c is the y-intercept , x and y are coordinates.
So, comparing equations, y=mx+c and KEmax=hυ−ϕ we get
y=KEmax x=υ m=h c=−ϕ
So, if we plot a graph with KEmax along the Y-axis and υ along the X-axis, the slope will be h. As we know, Planck’s constant h is a universal constant. Therefore, for every KEmax-υ (frequency) graph representing photoelectric effect, the slope will be the same. Since the slope is positive, the graph must be tilted upward and not downward.
Since c=−ϕ, the y-intercept of a KEmax-υ (frequency) graph will vary depending on the work function of the metal used.
The x-intercept of the equation y=mx+c is obtained if we take y=0.
Since here y=KEmax, we put KEmax=0. Then, equation KEmax=hυ−ϕ becomes
0=hυ−ϕ ⟹υ=hϕ
So, υ=hϕ is the x-intercept. Since work function is different for different metals, the x-intercept will not be a constant for all graphs.
Therefore, the statement for option (C) “All graphs like this must have the same slope” only is correct.
Note:
In geometry, the y-intercept is the point of intersection of the graph with the X-axis. x-intercept is the point where the graph intersects the Y-axis.
We can also say that the energy of the photon is utilised for the ejection of the electron from the metal and the rest is used as the kinetic energy of the electron.
The energy of the photon is utilised for the ejection of the electron from the metal and the rest is used as the kinetic energy of the electron.