Question
Question: How do we graph for \[x = {e^y}?\]...
How do we graph for x=ey?
Solution
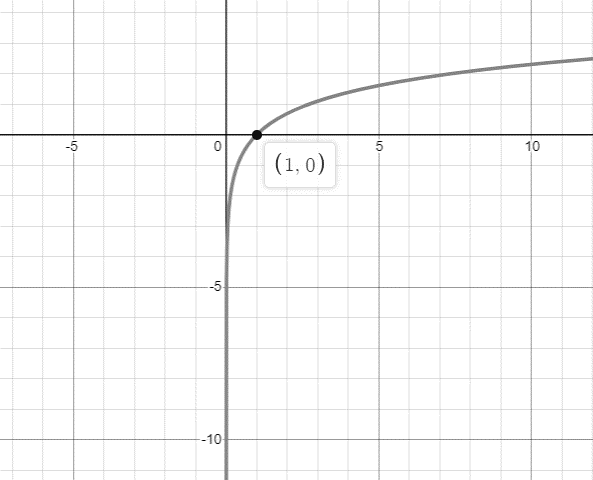
In this question, we have an equation. To plot the graph for a lot of expression, you build a table and choose values for x from which you calculate y. But, in this case it is the other way round. You choose values for y and then calculate x. So, you are plotting x against y. To calculate the result for x=ey rotate the result of y=ex clockwise 90∘.
Complete step by step answer:
In this question, an equation x=ey is given, that wants to plot the graph for x. First, we know about the graph, the graph can be defined as a pictorial representation or a diagram that represents data or values in an organised manner. The points on the graph often represent the relationship between two or more things.
There are four types of graphs.
Bar graphs: Bar graph is a diagram that uses narrow bands of different height to show different amounts so that they can be compared.
Histogram: Histogram is a graphical display of data using bars of different heights. The height of each bar shows how many fall into each range.
Pie chart: Pie chart is a circular statical graphic, which is divided into slices to illustrate numerical proportion.
Cartesian graph:
The graph for the equation y=ex is a bit more difficult to graph, because just about all of y values will be decimal approximations. But if I round off to a reasonable number of decimal places (one or two is generally fine for the purpose of graphing), then this graph will be fairly easy.
Calculate the value of y for the different values of x.
For x=−2, the value of y is.
⇒e−2≈0⋅135
For x=−1, the value of y is.
⇒e−1≈0⋅368
For x=0, the value of y is.
⇒e0≈1
For x=1, the value of y is.
⇒e1≈2⋅718
For x=2, the value of y is.
⇒e2≈7⋅389
For x=3, the value of y is.
⇒e3≈20.086
The graph for the equation y=ex is shown in Figure (1).
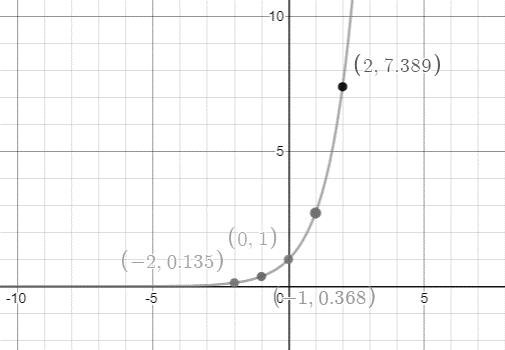
Figure 1
To calculate the graph for x=ey, rotate the graph of the equation clockwise 90∘.
Note:
If you have to plot the graph for the equation you build a table and choose values for x from which you calculate y. And plot the coordinate in the cartesian graph for values of y for different values of x. The shown curve or lines is the graph for that equation.