Question
Question: How do I graph \(x > - 2\) on a coordinate plane?...
How do I graph x>−2 on a coordinate plane?
Solution
A basic understanding of plotting the graph is required for solving the given sum. In this type of sum, the student has to know that if the equation involves only x, then the line would be parallel to y−axis. If the equation consists of only y i.e. value of xis 0, the line would be parallel to x−axis. In this sum it is given that we have to plot the graph for x>−2. Since it doesn’t consist of y we can say that the graph for this sum would be parallel to y−axis. Also since it is given that we have to plot for x>−2, so all the values which are greater than −2 would be included in this graph.
Complete Step by Step Solution:
The first step to plot a graph is to first change the sign for simplicity and consider it as x=−2.
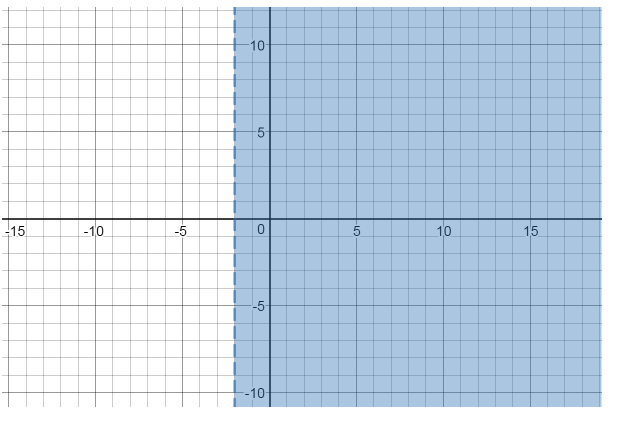
The student should plot a vertical line at x=−2,indicating that all x-coordinates are equal to −2.
Since the plotting has to be done for x>−2, all the points on the right side of −2 have to be shaded.
Thus the graph of the inequality is shaded in blue. The vertical line x=−2 is dashed rather than a solid line indicating that the line is not included.
Note: Whenever a sum on inequality is given, the first thing a student should do before plotting is to change the sign to=. After changing the sign the student should plot the graph. This is because it is not possible to draw any graph with an inequality sign, that is the reason we consider = and then make the line dashed to show the inequality. This holds true for inequalities having both x&y variables in the equation. Thus the student should be careful with using signs while plotting a graph.