Question
Question: How do I graph the rational function \(y=\dfrac{\left( x-1 \right)\left( x-5 \right)}{\left( x+3 \ri...
How do I graph the rational function y=(x+3)(x−3)(x−1)(x−5) on a graphing calculator?
Solution
For graphing the given function on a graphing calculator, we first need to enter the equation in the calculator. For this, we have to press the y= button on the calculator. Then we have to get the minimum and the maximum values of the variables x and y by using the window button. Then finally pressing the graph button on the calculator, we will obtain the graph of the given equation.
Complete step-by-step solution:
The rational function given in the above question is
⇒y=(x+3)(x−3)(x−1)(x−5)
For graphing the function, we need to enter the above equation in the calculator. For this, we have to enter the “y equals screen” of the calculator by pressing the button labelled “y=” on the top left of the calculator. After that, you will get a screen where you can enter a number of equations to be graphed. Using the button labelled “X,T,O,n” on the calculator, we can put the variable x wherever required according to the above equation. After entering the equation, it will be stored in the memory of the graphing calculator. Now, we can obtain its graph on the screen of the graphing calculator.
Now, before obtaining the graph on the screen, we need to adjust the window of the calculator so as to make sure that the graph is clearly visible on the entire screen. For this, we need to press the second button labelled “window” on the top of the graphing calculator. There we will have the options to set the minimum and the maximum of the independent and the dependent variables x and y respectively. By setting them according to the given equation, the window will be optimised. By default, the minimum values of the variables x and y are set equal to −10 each, and the maximum values of the variables x and y are set to 10 each. We can keep them as it is for the case of the given equation.
Then on pressing the rightmost button on the top of the graphing calculator labelled as “graph”, we will obtain the required graph of the given equation as
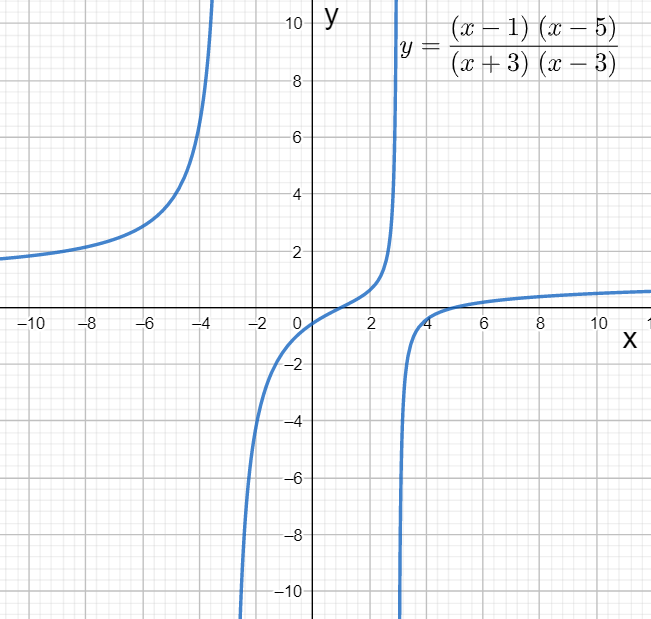
Hence, we have graphed the graph of the given equation using the graphing calculator.
Note: We have used the T1-84 calculator for graphing the given function. We can use the T1-83 calculator and the other calculators too, but the steps in the above solution might not fit for the other calculators. For tracing the different points on the graph, we can press the “trace” button located on the top of the calculator.