Question
Question: How do I describe and explain the position of a median in a box plot?...
How do I describe and explain the position of a median in a box plot?
Solution
We are given a question based on box plot. Median can be described as the middle number in a list which is sorted (either ascending or descending), basically an average of the list of the numbers. Median is positioned inside the box which can take center position if the distribution is uniform, or is skewed (shift away from the center) when the distribution is not uniform.
Complete step-by-step answer:
According to the given question, we are asked to explain the position of a median in a box plot. We will first start with what is a box plot.
Box plot, which is actually a box and whisker plot, is a graphical representation of information in a five number summary. This type of plot is very useful when the information given is huge. It is also very helpful when comparing two or more than two scenarios. It can be said to be an ideal when comparing the distributions as the differences are distinctly apparent in the plot.
A box plot looks like as given below.
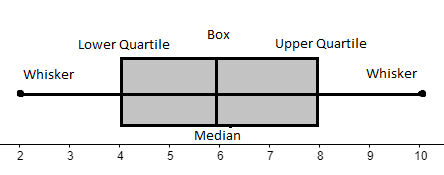
From the above we get,
- the whiskers are the two lines outside the box and the points represent the highest and the lowest observation in a data set
- the box ends are called the quartile
- and the box has a median within it represented by a vertical line, it can be in the middle or may get skewed in one direction due to the distribution
So, this type of plot proves useful for explanatory purposes. The essential values (like the extreme observation, the central observation, etc.) are very evident and at times self-explanatory.
Median is the average of the numbers in a sorted list. If the amount if numbers is odd, the middle number is the median and if the amount of the numbers is even then, the median is the average of the middle two numbers.
The median line is always represented by a vertical line inside the box. The position of the median is not necessarily the center of the box always. In some data set, the median line is in the middle of the box, but in some other data set, the median is skewed to one of the direction and is not in the middle of the box. The position of the median is dependent of the distribution of the data set provided.
For example –
When median is in the center the plot looks like,
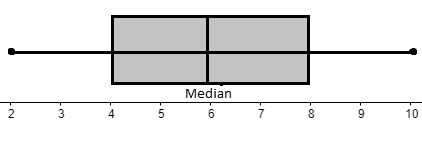
Here, the distribution can be said to have done uniformly and so the median is in the center the box.
When the median is skewed the plot looks like,
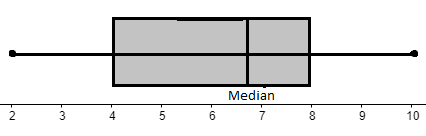
So, the distribution is skewed in the right direction, so we have the median shifted away from the center towards the right.
Therefore, the position of the median is always inside the box and is dependent on the distribution.
Note: While calculating the five number summary for the box plot, the list should first be arranged in either ascending or descending order. Then, we calculate the upper and lower quartile and the median carefully, keeping in mind the order in which the list is sorted.