Question
Question: How can I draw activation energy in a diagram?...
How can I draw activation energy in a diagram?
Solution
The energy changes that occur during a chemical reaction can be shown in a diagram called a potential energy diagram, or sometimes called a reaction progress curve.
The activation energy is depicted by potential energy.
A potential energy diagram shows the change in potential energy of a system as reactants are converted into products.. The total potential energy of the system increases for the endothermic reaction as the system absorbs energy from the surroundings. The total potential energy of the system decreases for the exothermic reaction as the system releases energy to the surroundings.
Complete step by step answer:
The activation energy for a reaction is illustrated in the potential energy diagram by the height of the hill between the reactants and the products.
For this reason, the activation energy of a reaction is sometimes referred to as the activation energy barrier. Reacting particles must have enough energy so that when they collide they can overcome that barrier
Draw and label a pair of axes.
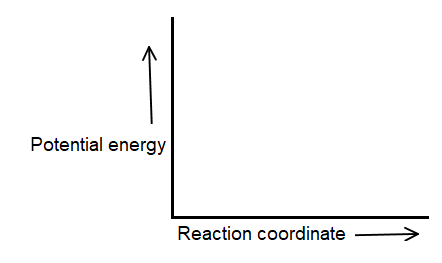
Label the vertical axis "Potential Energy" and the horizontal axis "Reaction Coordinate".
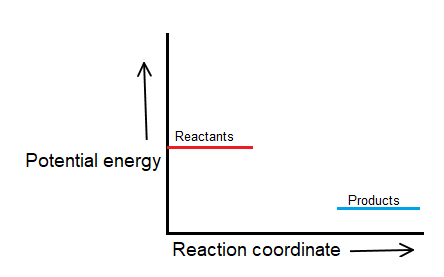
Draw and label two short horizontal lines to mark the energies of the reactants and products.
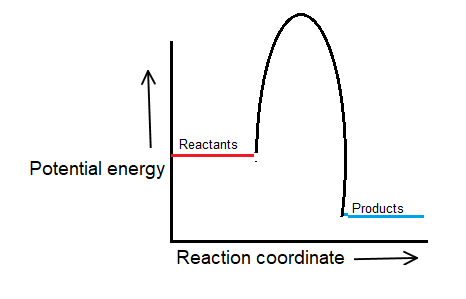
There must be a hump in the curve to represent the energy level of the activated complex.
Draw and label the activation energy.
Draw a horizontal line from the highest part of the curve towards the vertical axis.
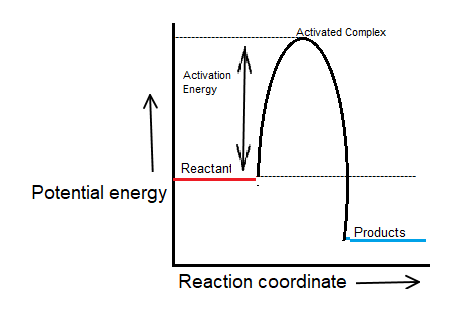
The activation energy Ea is the difference between the energy of the activated complex and that of the reactants.
Ea=Eactivated;complex–Ereactants
Note: Activation energy concepts help us to understand the chemical kinetics of a reaction as well as it helps us to know the energy involved during the reaction.