Question
Question: HNO$_3$(aq) is titrated with NaOH(aq) conductometrically, graphical representation of the titration ...
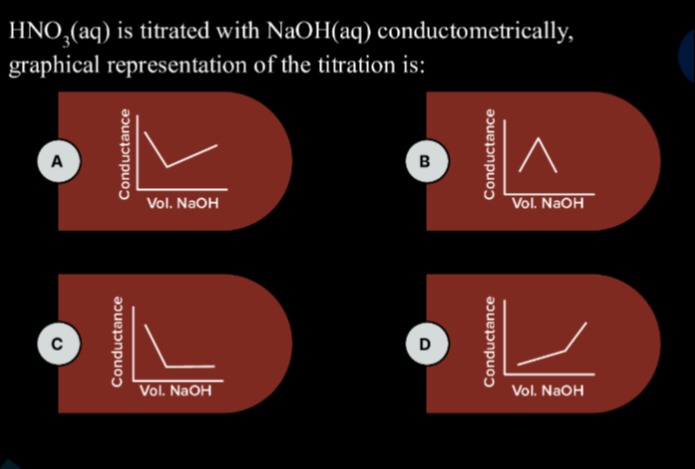
HNO3(aq) is titrated with NaOH(aq) conductometrically, graphical representation of the titration is:
A
Solution
The titration of a strong acid (HNO3) with a strong base (NaOH) is a conductometric titration where the conductance of the solution is monitored as the titrant is added.
Initially, the solution contains HNO3, which is completely dissociated into H+ and NO3− ions. The initial conductance is high due to the presence of highly mobile H+ ions.
As NaOH is added, the following reaction occurs:
H+(aq)+NO3−(aq)+Na+(aq)+OH−(aq)→Na+(aq)+NO3−(aq)+H2O(l)
The net ionic reaction is:
H+(aq)+OH−(aq)→H2O(l)
Before the equivalence point, the added OH− ions react with H+ ions to form water. Effectively, highly mobile H+ ions are replaced by less mobile Na+ ions (since Na+ ions are added along with OH− from NaOH). The molar conductivity of H+ is significantly higher than that of Na+. Therefore, as NaOH is added, the concentration of H+ decreases and the concentration of Na+ increases, leading to a decrease in the overall conductance of the solution.
At the equivalence point, all the H+ ions have been neutralized by OH− ions. The solution contains primarily Na+ and NO3− ions (from the reaction product NaNO3). The conductance at the equivalence point is at a minimum.
After the equivalence point, excess NaOH is added to the solution. The solution now contains Na+, NO3−, and excess Na+ and OH− ions. The addition of excess NaOH increases the concentration of Na+ and OH− ions. Since OH− ions have a relatively high molar conductivity, the conductance of the solution increases significantly after the equivalence point.
Thus, the graphical representation of the conductometric titration of HNO3 with NaOH shows an initial decrease in conductance, followed by a minimum at the equivalence point, and then an increase in conductance after the equivalence point. The graph consists of two intersecting lines. The first line has a negative slope (conductance decreases) and the second line has a positive slope (conductance increases). The point of intersection represents the equivalence point.
Looking at the given options, option A shows a graph with an initial decrease in conductance followed by an increase in conductance. This correctly represents the conductometric titration of a strong acid with a strong base.