Question
Question: Have you ever noticed that when you reach into a bag of M and \[{M^1}\]s, that you are most likely t...
Have you ever noticed that when you reach into a bag of M and M1s, that you are most likely to pull out a brown one?
A group of students studied the mass spectrum of a new element they wanted to name cadmium is shown below.
What is the relative atomic mass of cadmium?
Solution
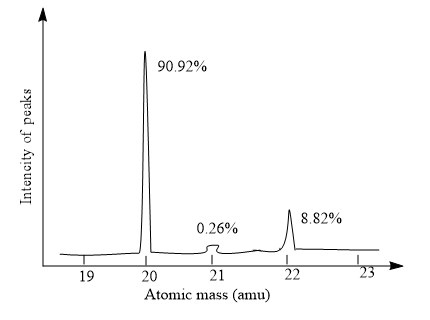
Here, given a graphical representation of the mass spectrum of the element candium with, the intensity of peaks on the y-axis and atomic mass is along the x-axis. And it shows three peaks. And the tallest peak will indicate the base peak and it is a particularly stable ion. And the mass spectrum, which represents a plot of intensity vs m/z ratio. And m/z ratio indicates the mass to charge ratio.
Complete answer:
In the given plot, the base peak shows at the atomic mass 20 and the intensity of the peaks is equal to 90.92%. And the element with atomic mass 21 shows the intensity of the peak at0.26%. The element with atomic mass 22 shows the peak with intensity 8.82%.
The relative atomic mass of an element is the sum of the product of the percentage of peaks and the atomic mass and the formula of relative atomic mass can be written as,
Σ%ofpeaks×atomicmass
20→90.92%
21→0.26%
22→8.82%
Substitute the values in above equation, will get,
Relative atomic mass=10090.92×20+1000.26×21+1008.82×22
=18.184+0.0546+1.9404
=20.179
Hence, the relative atomic mass of candium is equal to 20.179.
Note:
From the given plot of the mass spectrum, we get the relative atomic mass of cadmium is equal to 20.179. And it is a pattern that represents the distribution of the ions by using the mass to charge ratio. To read a mass spectrum, first, we have to identify the molecular ion and next to identify the fragmentation. And calculate the Δm of each peak. If there are any heteroatoms, identify them also, after that name the molecule.