Question
Question: Graphs representing Boyle’s law is (are): A: :
A: 
B: 
C: 
D: 
Solution
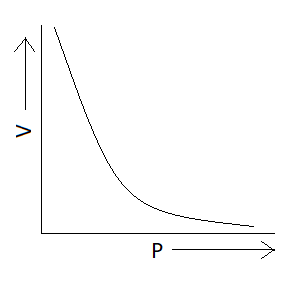
Boyle’s law states that pressure of a given substance varies inversely with its volume at constant temperature. According to this law PV=k where P is pressure, V is volume and k is a constant. According to this equation the product of pressure and volume is constant.
Complete step by step answer:
We know Boyle's law states that the product of pressure and volume is constant at a given temperature. Now we have to find the option in which graph represents product of pressure and volume constant or we can also say that the option in which pressure varies inversely with volume (P∝V1) . We know that the graph is exponential if we have quantities that vary inversely with each other. There is only one option which represents an exponential graph and that option is option A. This means correct option is option A that is:
Additional information: Charles’s law tells that for an ideal gas when pressure is constant volume is directly proportional to the temperature. According to this law PV=nRT
Where,P is pressure, V is volume, n is number of moles, R is gas constant and T is temperature of gas (in Kelvin).
According to Gay-Lussac’s law at constant volume pressure is directly proportional to the temperature of gas. According to this law P∝T
Where,P is pressure and T is temperature.
Note:
The ideal gas model tends to fail at lower temperatures or higher pressures, when intermolecular forces and molecular size becomes important. It also fails for most heavy gases, such as many refrigerants and for gases with strong intermolecular forces, notably water vapour.