Question
Question: The acceleration versus time graph of a particle is as shown in figure. The respective v - t graph o...
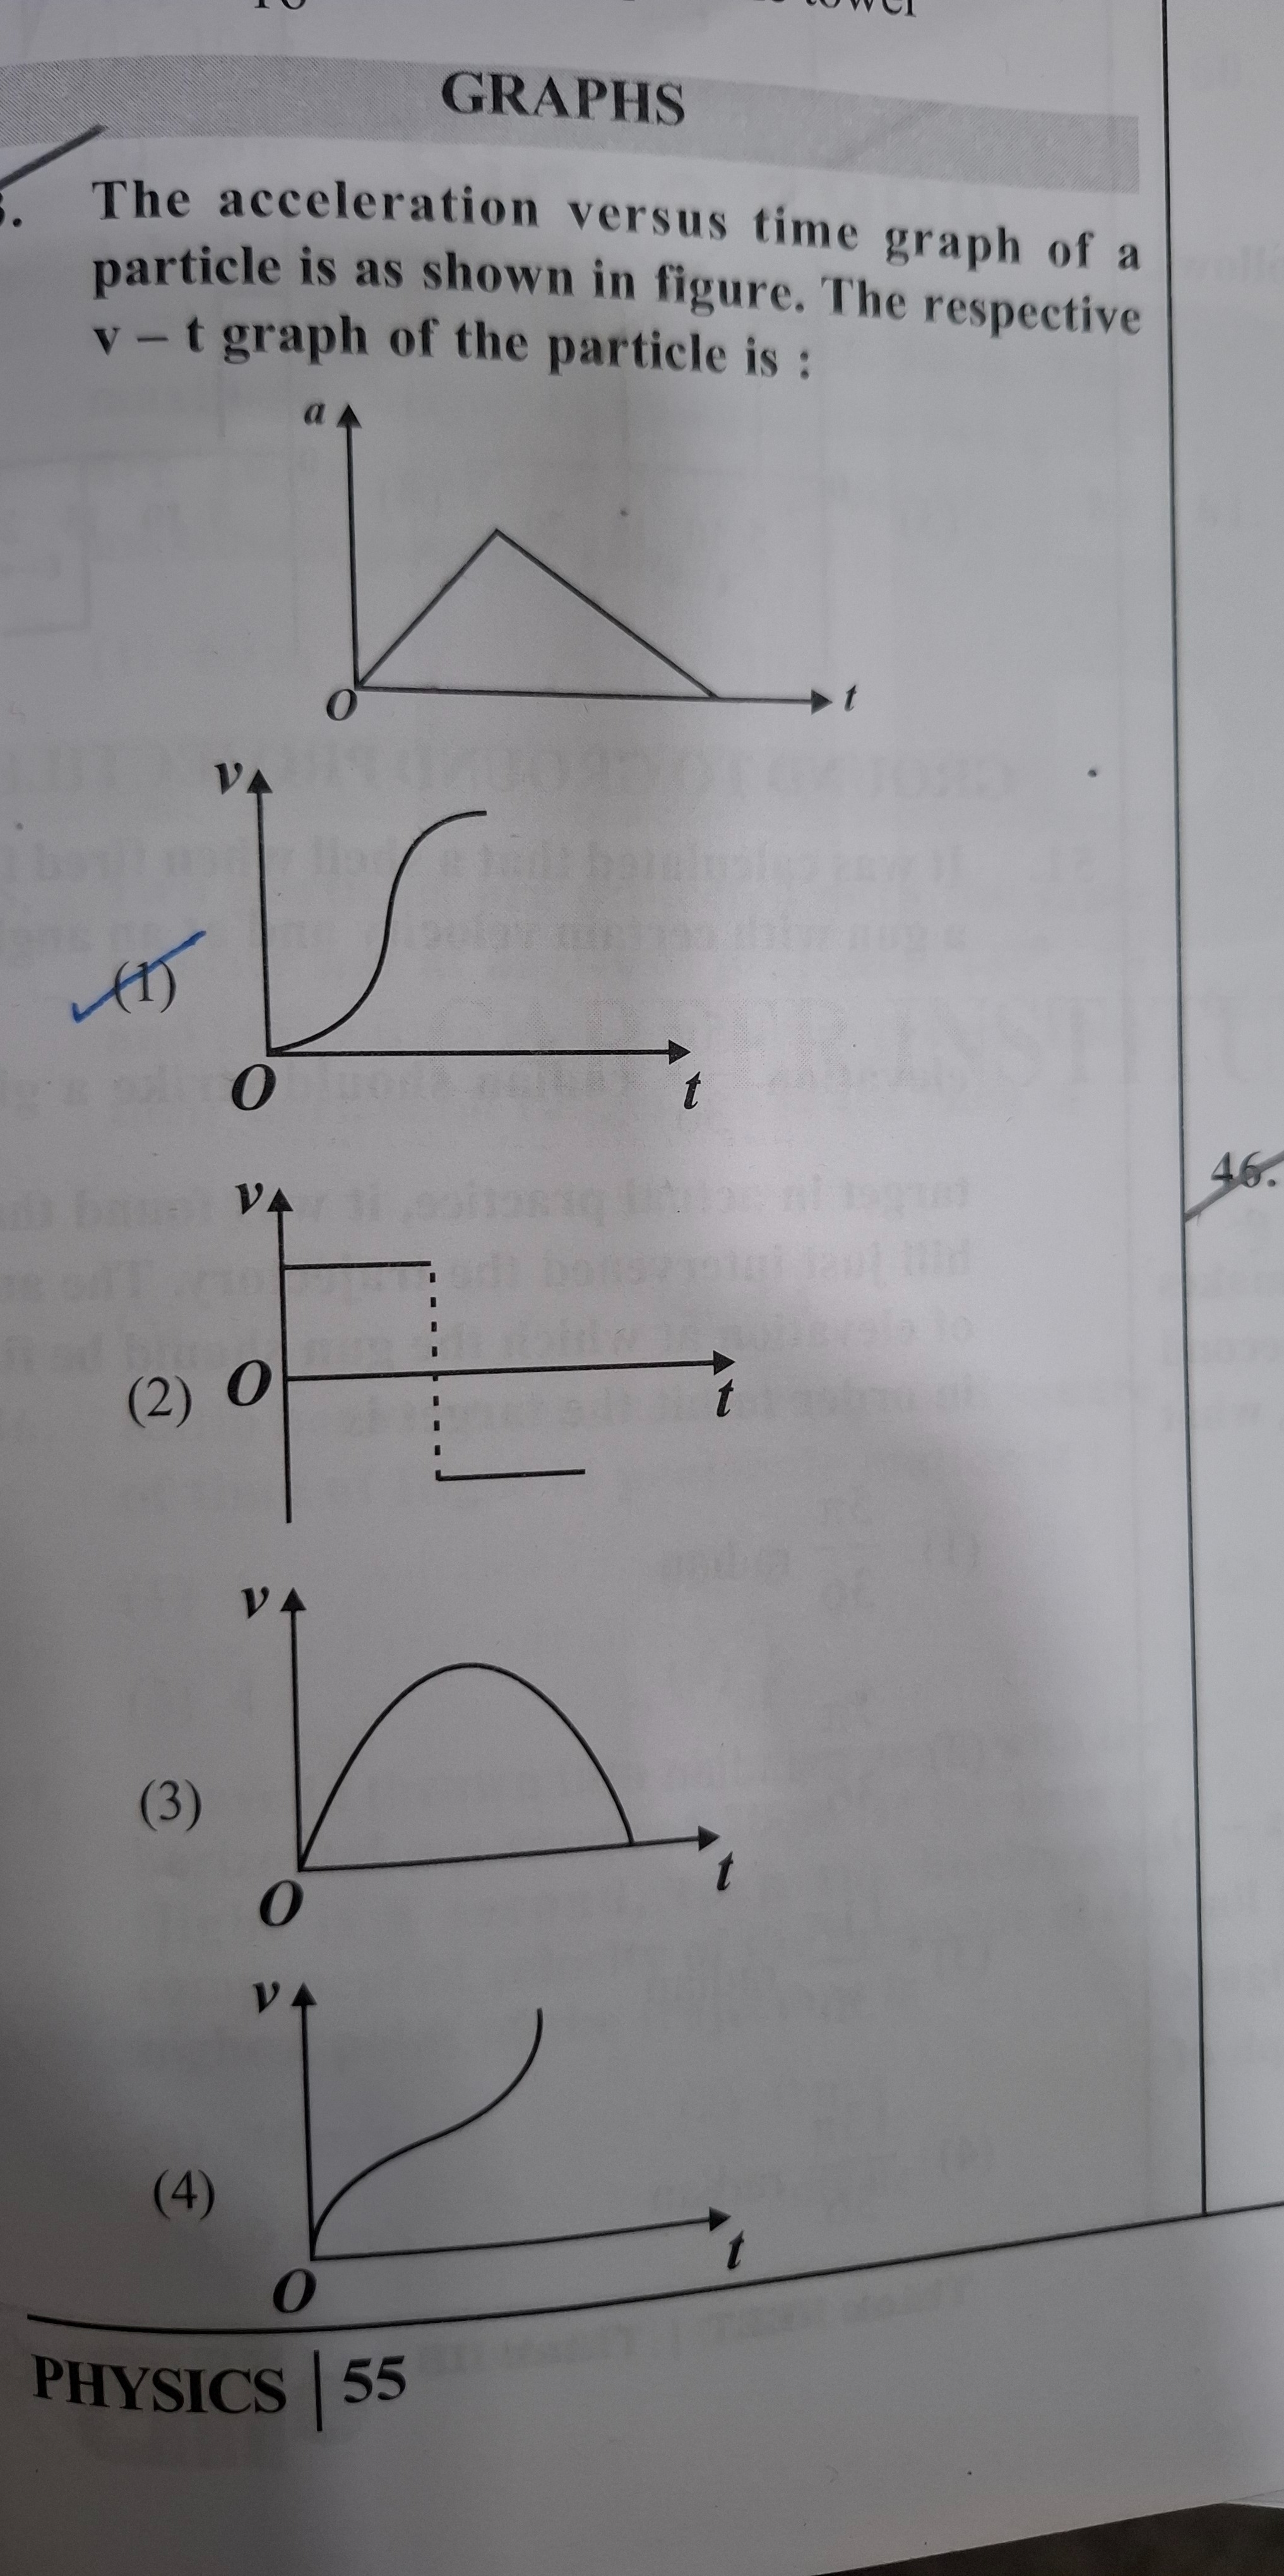
The acceleration versus time graph of a particle is as shown in figure. The respective v - t graph of the particle is :
1
Solution
To determine the velocity-time (v-t) graph from the given acceleration-time (a-t) graph, we need to understand the relationship between acceleration and velocity.
-
Relationship:
- Acceleration a=dtdv, which means the acceleration at any instant is the slope of the v-t graph at that instant.
- Velocity v=∫adt, which means the change in velocity is the area under the a-t graph.
-
Analysis of the given a-t graph: The a-t graph can be divided into two main segments:
-
Segment 1 (from t=0 to t=t1, the peak of acceleration):
- Acceleration
astarts from 0 and increases linearly with time. So,ais positive and increasing. - Since
ais the slope of the v-t graph, the slope of the v-t graph must be positive and increasing. - A curve with an increasing positive slope is concave upwards.
- If the particle starts from rest (v=0 at t=0, which is a common assumption for such problems unless stated otherwise, and consistent with the options starting from origin), then the velocity will be v∝t2 (parabolic, concave up).
- Acceleration
-
Segment 2 (from t=t1 to t=t2, where acceleration becomes zero again):
- Acceleration
astarts from its maximum value (at t1) and decreases linearly to 0 (at t2). So,ais positive but decreasing. - Since
ais the slope of the v-t graph, the slope of the v-t graph must be positive but decreasing. - A curve with a decreasing positive slope is concave downwards.
- At t=t2, acceleration becomes zero, meaning the slope of the v-t graph becomes zero. This indicates that velocity reaches its maximum value at t=t2.
- Acceleration
-
-
Evaluating the options:
-
Option (1):
- Starts from v=0.
- In the first segment, the curve is concave up, and its slope is increasing, consistent with increasing positive acceleration.
- In the second segment, the curve is concave down, and its slope is decreasing, consistent with decreasing positive acceleration.
- At the end point, the slope becomes zero, consistent with acceleration becoming zero.
- The velocity is always increasing, as acceleration is always non-negative.
- This graph perfectly matches all the characteristics derived from the a-t graph.
-
Option (2): Shows constant velocity (zero acceleration), then a sudden drop, which is incorrect.
-
Option (3): Shows the curve initially concave down, which means decreasing acceleration, contradicting the first segment of the a-t graph where acceleration is increasing. Also, the velocity decreases after reaching a maximum, implying negative acceleration, which is not present in the given a-t graph.
-
Option (4): Shows the curve as concave down throughout, implying acceleration is always decreasing. This contradicts the first segment of the a-t graph where acceleration is increasing.
-
Therefore, option (1) is the correct v-t graph.