Question
Question: graph \[V - I\] of a conductor at two different temperatures is shown in fig. the ratio of temperatu...
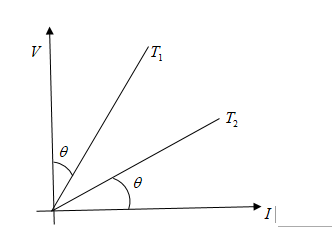
graph V−I of a conductor at two different temperatures is shown in fig. the ratio of temperature T2T1 is:
(A) tan2θ
B) cot2θ
C) sec2θ
D) cosec2θ
Solution
Hint As we can see in the figure that V and I are making a right angle triangle, and T1 is making angle θ with voltage and similarly T2 is making θ angle with current. So, we apply trigonometry functions to solve this problem.
Complete Step by step solution
As per figure, we can see that
T1=tanθ
And T2=tan(90−θ)
We know that the value of tan(90−θ)will become cotθ
Now, we can say that T2=cotθ
To find out the ratio of T2T1......(1)
We will put the values of T1 and T2in equation (1)
T2T1=cotθtanθ......(2)
We know that cotθ=tanθ1, we put it equation (2)
T2T1=tan2θ
Hence, option a is the right answer
Note We should keep in mind trigonometry formulas to solve this problem. As we know that 90−θmeans value will lies in first quadrant and in first quadrant tanθ will convert in cotθ, so the value of tan(90−θ) will become cotθ
Additional information V−I graph stands for a graph of voltage and current, and it shows us properties of a conductor or device. V−I Graph tells valuable information about the resistance in the circuit and breakdown of the electronic component. This information helps us place the electronic component in an electronic circuit. Voltage lies on y−axis and current lies on x−axis, resistance tells us the type of the graph. If resistance is constant, the graph will be linear and if resistance is not constant means variable then the graph will be non-linear.
There are different types of V−I graphs, which are as below:
Linear V−I graph
Non-linear V−I graph
V−I Characteristics of SCR
V−I Characteristics of LED
V−I Characteristics of MOSFET
V−I Characteristics of PN Junction Diode
V−I Characteristics of Zener Diode