Question
Question: Graph the trigonometric equation \( y = 3\cos x \)...
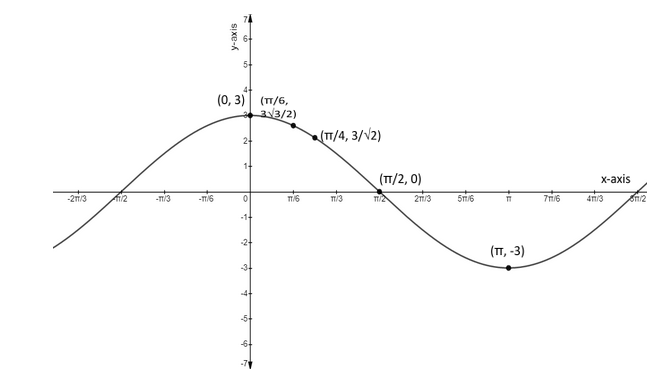
Graph the trigonometric equation y=3cosx
Solution
Hint : If in an equation, there are one or more than one trigonometric ratios [sine (sin) , cosine (cos) , tangent (tan) , cotangent (cot) , secant (sec) , cosecant (cosec) ] of unknown angles, it is said to be trigonometric equation and here, we have to make a graph of the given trigonometric equation.
Complete step-by-step answer :
To make a graph of the trigonometric equation, we have a function, f(x)=acosb(x+c)+d
On comparing the function y=3cosx with the above function, we have found that only the parameter a, means 3 will affect our function. Now, let us assume the values of x in the function f(x) which is equal to y.
Part-1 Let us assume the value of x be 0 , then the function f(x) becomes,
f(0)=3cos(0)=3×1=3
And we know that, f(x)=y , then the value of y becomes 3 .
Part-2 Let us assume the value of x be 6π , then the function f(x) becomes,
f(6π)=3cos(6π)=3×(23)=233
And we know that, f(x)=y , then the value of y becomes 233 .
Part-3 Let us assume the value of x be 4π , then the function f(x) becomes,
f(4π)=3cos(4π)=3×21=23
And we know that, f(x)=y , then the value of y becomes 23 .
Part-4 Let us assume the value of x be 2π , then the function f(x) becomes,
f(2π)=3cos(2π)=3×0=0
And we know that, f(x)=y , then the value of y becomes 0 .
Part-5 Let us assume the value of x be π , then the function f(x) becomes,
f(π)=3cos(π)=3×(−1)=−3
And we know that, f(x)=y , then the value of y becomes −3 .
Hence, we have our values of x and y to plot the graph of y=3cosx and the graph is,
Note : To form a graph of cosine function, there is an equation i.e, f(x)=acosb(x+c)+d , where, a is the amplitude of the function, b affects the period as it is equal to b2π , if the value of b increases then the value of period decreases, c is the horizontal shift and d is the principal axis. The graph of the given trigonometric equation is quite easy to solve as only 3 is affecting the function.