Question
Question: Graph the function \[y = \cos 2x\]?...
Graph the function y=cos2x?
Solution
In this question, first we have to find the period and amplitude of the given function, and then take some values for x and then find the respective y for each x, then tabulate the values and with help of the table we will get the required graph.
Complete step-by-step answer:
The graph of y=cosx is like a wave that forever oscillates between. −1 and 1, in a shape that repeats itself every 2π units. Specifically, this means that the domain of cosx is all real numbers, and the range is [−1,1].
Now given function is y=cos2x,
Use the form y=asin(bx−c)+d to find the variables used to find the amplitude, period, phase shift, and vertical shift.
a=1,b=2,c=0, and d=0,
So here amplitude a=1,
Now period of the function is given by, ∣b∣2π from the given data,
So, substituting the value of b=2 in the period formula, we get,
⇒∣2∣2π=π,
Period of the given function will be π,
Now select some values to graph the function,
When x=0,
\Rightarrow $$$$y = \cos 2x,
Now simplifying we get,
⇒y=cos2(0),
Now simplifying we get,
y=cos0=1
When x=2π,
⇒y=cos2(2π),
Now simplifying we get,
⇒y=cosπ=−1,
When x=π,
⇒y=cos2(π),
Now simplifying we get,
⇒y=cos2π=1,
When x=23π,
⇒y=cos2(23π),
Now simplifying we get,
⇒y=cos3π=−1,
When x=2π,
⇒y=cos2(2π),
Now simplifying we get,
⇒y=cos4π=1,
Now tabulating the values we get,
| x | y |
|---|---|
| 0 | 1 |
| 2π | -1 |
| π | 1 |
| 23π | -1 |
| 2π | 1 |
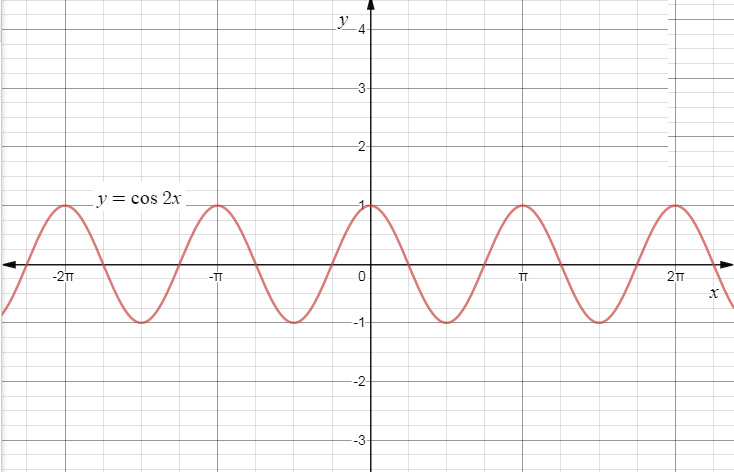
Now plotting the graphs we get,

∴The required graph for the function y=cos2x is,
Note:
To graph the cosine function, we mark the angle along the horizontal x axis, and for each angle, we put the cosine of that angle on the vertical y-axis. The graph, as seen above, is a smooth curve that varies from +1 to -1. It is the same shape as the cosine function but displaced to the left 90o. Curves that follow this shape are called 'sinusoidal' after the name of the sine function whose shape it resembles.