Question
Question: Graph of $y = P(x) = ax^5 + bx^4 + cx^3 + dx^2 + ex + f$, is given Question: If $P''(x) = 0$ has r...
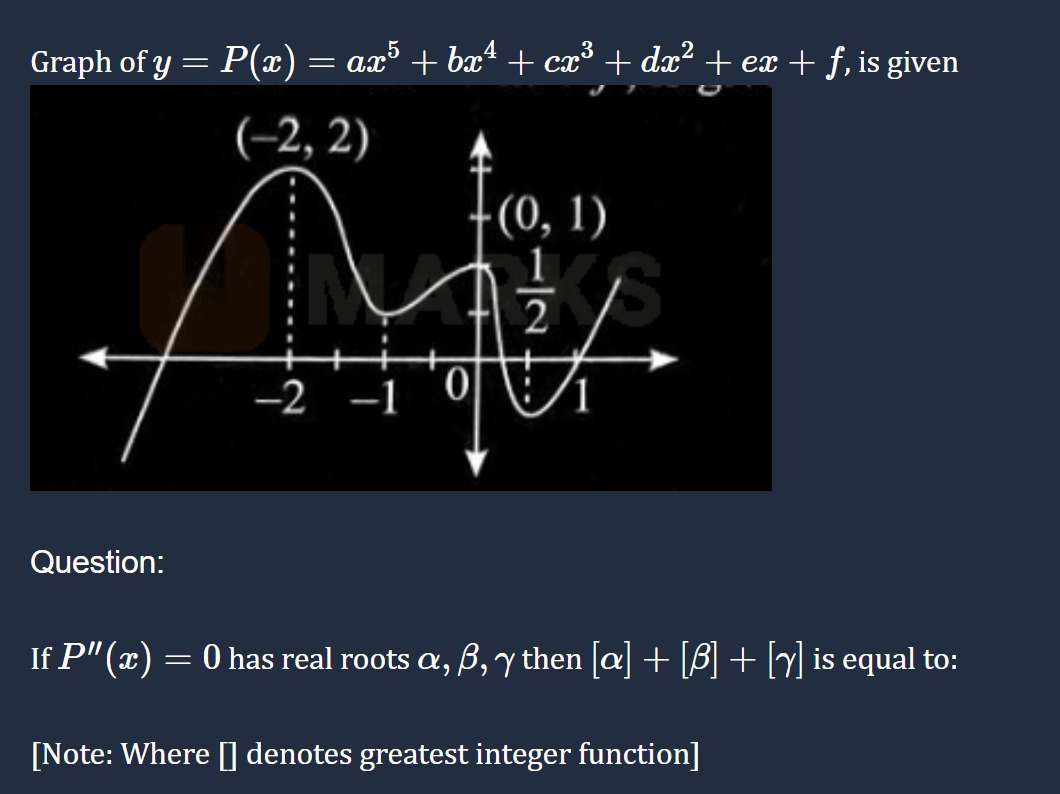
Graph of y=P(x)=ax5+bx4+cx3+dx2+ex+f, is given
Question:
If P′′(x)=0 has real roots α,β,γ then [α]+[β]+[γ] is equal to:
[Note: Where [] denotes greatest integer function]
A
5
B
-5
C
4
D
-4
Answer
-5
Explanation
Solution
The roots of P′′(x)=0 are the inflection points of the graph of y=P(x). An inflection point is where the concavity of the graph changes.
From the graph, we observe the changes in concavity:
- For x far to the left, the graph is concave down (bending downwards).
- The concavity changes from concave down to concave up somewhere before the local maximum at x=−2. Let this inflection point be α. From the graph, α appears to be between −3 and −2. A rough estimate might be around −2.5. So, −3<α<−2.
- The concavity changes from concave up to concave down somewhere between the local maximum at x=−2 and the local minimum at x=0. Let this inflection point be β. From the graph, β appears to be between −1 and 0. A rough estimate might be around −0.5. So, −1<β<0.
- The concavity changes from concave down to concave up somewhere after the local minimum at x=0. Let this inflection point be γ. From the graph, γ appears to be between 0 and 1. A rough estimate might be around 0.5. So, 0<γ<1.
We are given that P′′(x)=0 has real roots α,β,γ. These are the x-coordinates of the inflection points. From our observation of the graph, the approximate locations of the inflection points are in the intervals (−3,−2), (−1,0), and (0,1).
Based on these estimated intervals:
- If −3<α<−2, then [α]=−3.
- If −2<β<0, then [β]=−2 or −1.
- If 0<γ<1, then [γ]=0.
So, with the estimated intervals:
- −3<α<−2⟹[α]=−3
- −2<β<−1⟹[β]=−2
- 0<γ<1⟹[γ]=0
Then [α]+[β]+[γ]=−3+(−2)+0=−5.