Question
Question: The figure shows isotherms of a real gas compared to an ideal gas. Which of the following figures co...
The figure shows isotherms of a real gas compared to an ideal gas. Which of the following figures correctly represents the behavior of Hydrogen gas at 25°C?
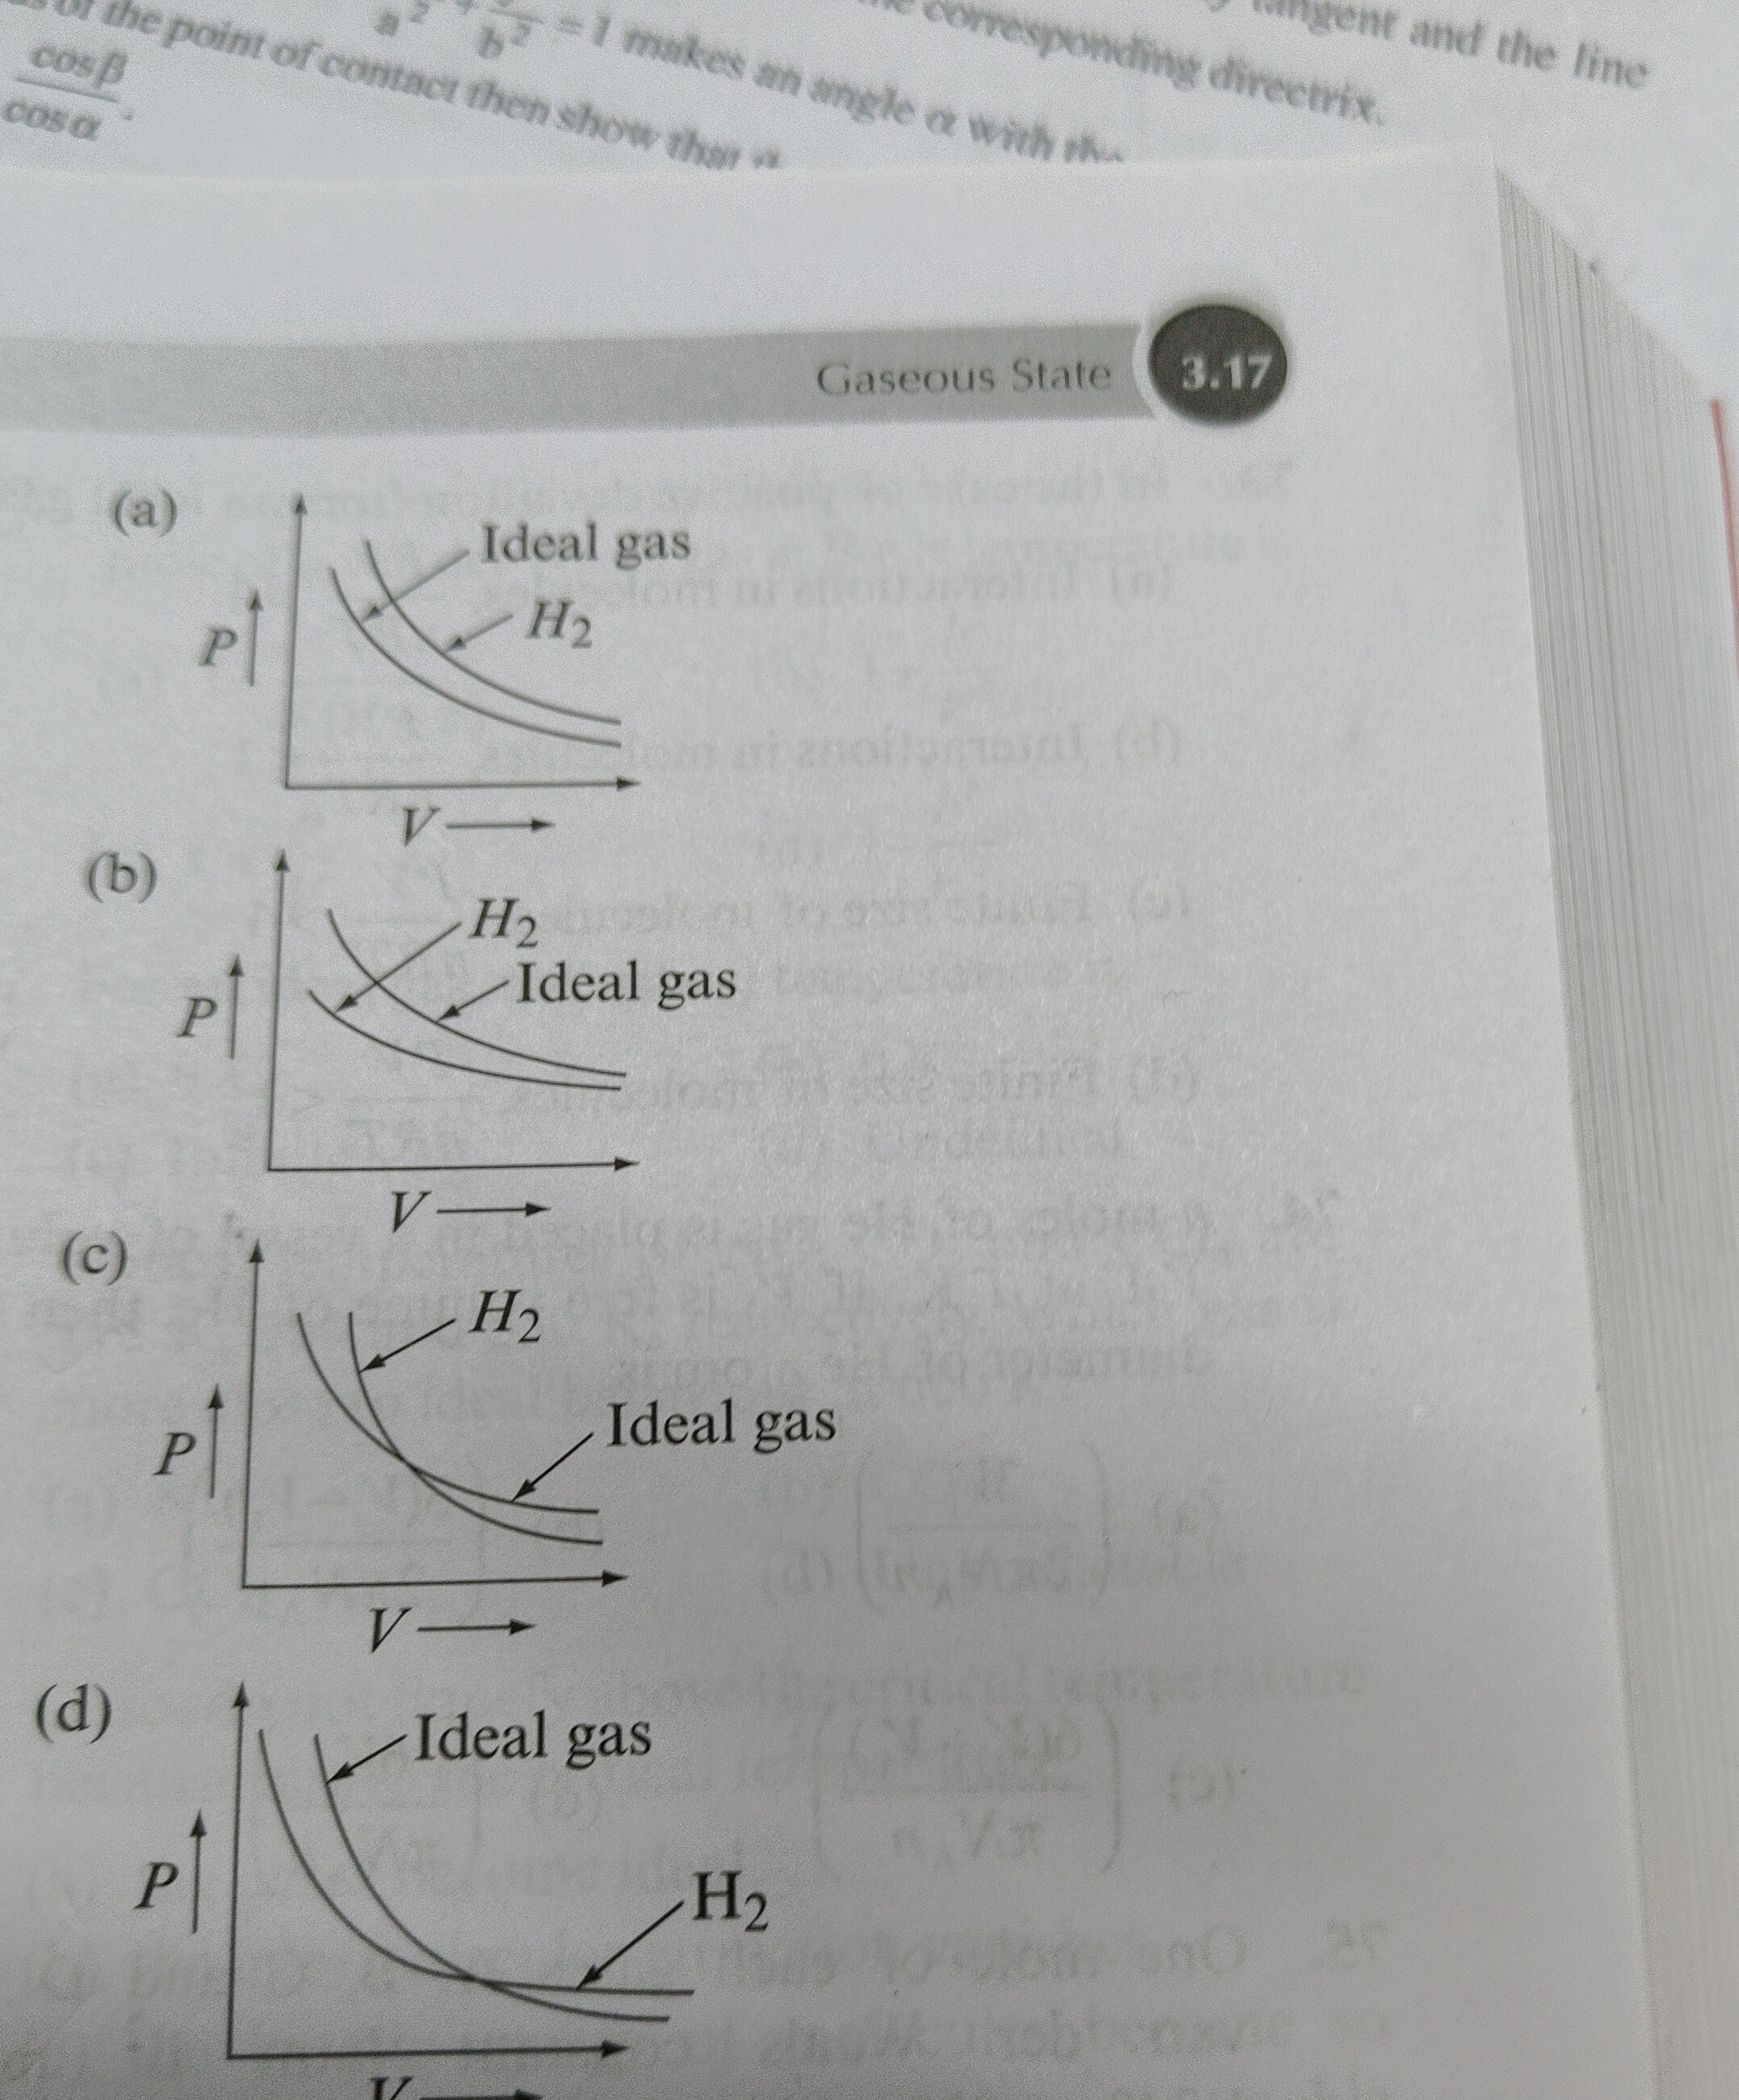
(a)
(b)
(c)
(d)
(a)
Solution
The compressibility factor Z=nRTPV describes the deviation of a real gas from ideal behavior (Z=1). For a van der Waals gas, Z=V−nbV−RTVa. The term RTVa accounts for attractive forces, while V−nbV accounts for repulsive forces. The Boyle temperature (TB) is where a gas behaves most ideally. For a van der Waals gas, TB=Rba. For Hydrogen (H2), a=0.244L2atm/mol2 and b=0.0266L/mol. Thus, TB=0.0821×0.02660.244≈112K (-161°C). At temperatures T>TB, Z is always greater than 1, meaning the real gas pressure is always greater than the ideal gas pressure. Since 25°C (298 K) is much greater than TB (112 K), Hydrogen gas will behave such that its isotherm is always above the ideal gas isotherm.