Question
Question: For two thermodynamic processes, temperature and volume diagrams are given. In the first process, it...
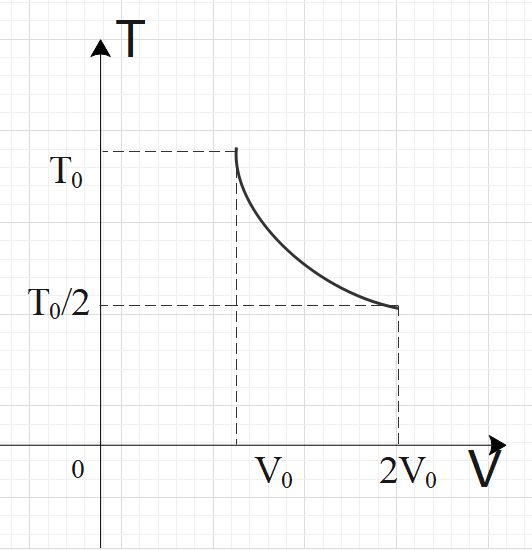
For two thermodynamic processes, temperature and volume diagrams are given. In the first process, it is a straight line having initial and final coordinates as (V0,T0)and (2V0,2T0), where as in the second process it is a rectangular hyperbola having initial and final coordinates (V0,T0) and (2V0,2T0). Then ratio of work done in the two processes must be

a) 1:2
b) 2:1
c) 1:1
d) None of the above
Solution
For an ideal gas, PV=nRT is applicable. In graph-1, we have a straight-line relation between temperature and volume, so we can say by ideal gas relation that pressure is constant in graph-1. For the second graph, we have a rectangular hyperbola relation between temperature and volume, i.e. TV=C. From both the relations, get the pressure in terms of temperature and volume. Now, calculate the work done by using the formula: W=V1∫V2PdV and compare the work done by both the processes to get the required ratio.
Complete step by step answer:
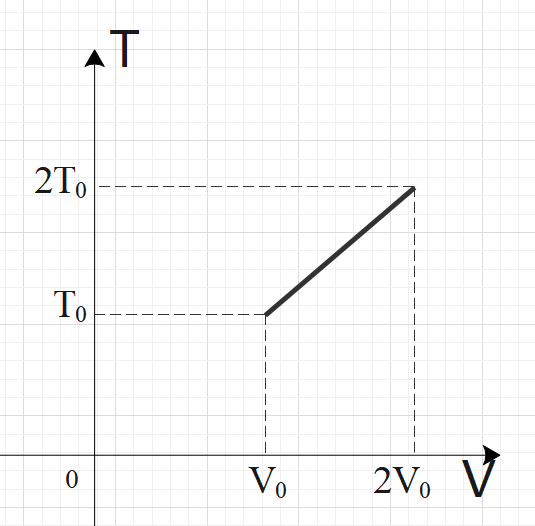
In the first process, we have a straight-line graph, i.e. the slope of the T-V graph is constant.
So, we can say that: VT=C
By ideal gas relation, we have: PV=nRT
We can also write the ideal gas equation as:
nRP=VT
Since VT=C, we can say that P is constant.
Now, we need to find the work done by the process 1
As we know that, W=V1∫V2PdV
So, for process-1, we can say: W1=V0∫2V0PdV
By ideal gas equation, PV=nRT
We have:
PdV=nRdT
So, we can write work done as: