Question
Question: For hydrogen like species, which of the following graphs provides the most appropriate representatio...
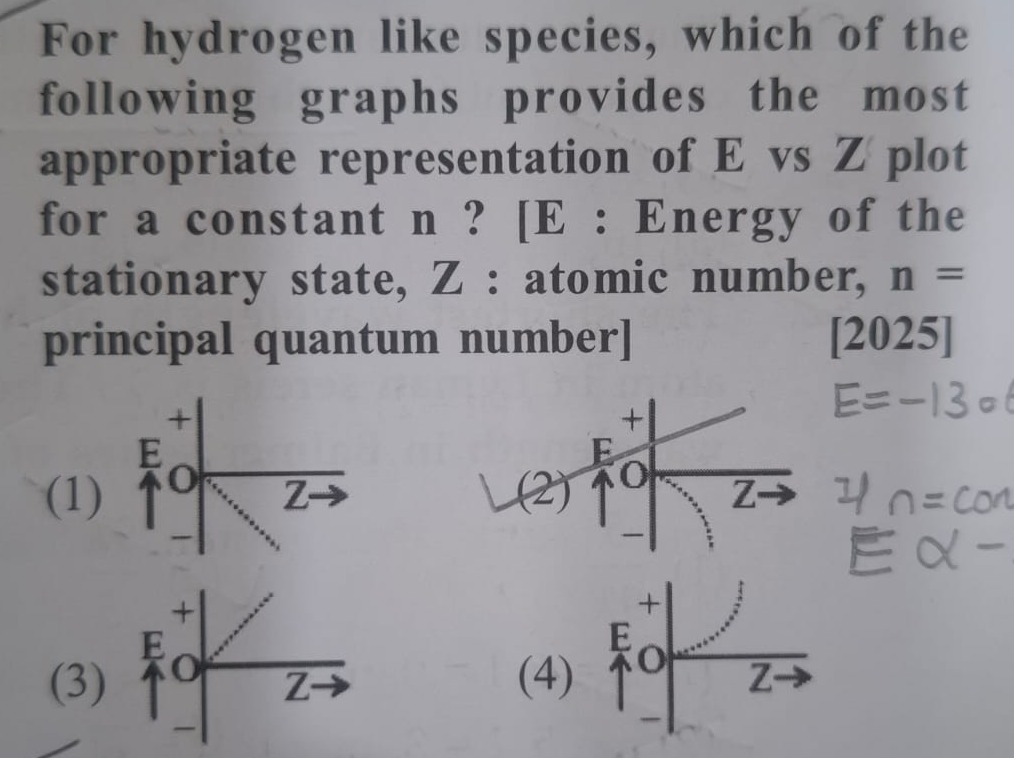
For hydrogen like species, which of the following graphs provides the most appropriate representation of E vs Z plot for a constant n ? [E : Energy of the stationary state, Z : atomic number, n = principal quantum number] [2025]
4
Solution
The energy of a stationary state for a hydrogen-like species is given by the Bohr model formula:
E=−13.6n2Z2 eV
where:
- E is the energy of the stationary state.
- Z is the atomic number.
- n is the principal quantum number.
The problem states that n is constant. Let's denote the constant value n2−13.6 as C. Since n is a positive integer, n2 is positive, and thus C will be a negative constant. So, the relationship between E and Z can be written as:
E=C⋅Z2
where C<0.
Let's analyze this relationship:
- Nature of E: Since C is negative and Z2 is always positive (as Z≥1), the energy E will always be negative. This means the graph should be in the region where E is below the Z-axis.
- Dependence on Z: The energy E is proportional to Z2. This indicates a parabolic relationship.
- Behavior as Z increases: As Z increases, Z2 increases. Since C is negative, the value of E will become more negative (i.e., its magnitude will increase, but the actual value will decrease).
Now let's examine the given graphs:
-
The Z-axis (horizontal axis) represents the atomic number, which is always positive (Z≥1).
-
The E-axis (vertical axis) represents energy. Positive E values are above the Z-axis, and negative E values are below the Z-axis.
-
Graph (1): Shows a linear decrease in E with increasing Z, and E is negative. This is incorrect because the relationship is quadratic (Z2), not linear.
-
Graph (2): Shows a linear increase in E with increasing Z, and E is positive. This is incorrect because E should be negative and the relationship is quadratic. The dotted line shows a parabolic curve in the positive E region, which is also incorrect.
-
Graph (3): Shows a linear increase in E with increasing Z, and E is positive. This is incorrect because E should be negative and the relationship is quadratic.
-
Graph (4): Shows E values in the negative region (below the Z-axis). As Z increases, the curve goes further down, meaning E becomes more negative. The shape of the curve is a downward-opening parabola, which is consistent with E=C⋅Z2 where C is a negative constant. This graph correctly represents the quadratic dependence and the negative nature of the energy for hydrogen-like species.
Therefore, Graph (4) provides the most appropriate representation.
Explanation of the solution: The energy of a hydrogen-like species is given by E=−13.6n2Z2. For constant n, E is proportional to −Z2. This means E is always negative and its magnitude increases quadratically with Z. Graph (4) correctly depicts a downward-opening parabolic curve in the negative energy region as Z increases.