Question
Question: For Freundlich isotherm, a graph of log \(\dfrac{x}{m}\) is plotted against log p. the slope of the ...
For Freundlich isotherm, a graph of log mx is plotted against log p. the slope of the line and its y-axis intercept, respectively corresponding to:
(A) log n1, k
(B) log n1, log k
(C) n1, K
(D) n1,log k
Solution
To answer this question we should be aware of the concept of Freundlich isotherm, its equation. Since the graph of logmx is to be plotted against log p. So, we have converted the main equation in log form then proceed with plotting.
Complete answer:
The relationship between the magnitude of adsorption and the pressure is expressed by an equation known as Freundlich isotherm.
a=kpn1 ……………………equation 1
Where, a = The amount of gas adsorbed per unit mass of absorbent.
p = pressure
k = constant that is depending on the nature of gas
n = Constant that is depending on the nature of absorbent.
The equation 1 can be explained in this way, the amount of gas adsorbed per unit mass of the adsorbent at pressure p, k and n are constants depending on the nature of gas and the nature of absorbent.
"a" can also be written as mx which gives the same definition as mentioned above. The amount of gas adsorbed per gram by adsorbate is divided by weight of adsorbent m.
Now, we can rewrite the above equation:
mx=kpn1 …………………equation 2
Taking log on both sides,
log mx = log K + n1log p…………………..equation 3
Now, let see about plotting graph:
At a given temperature, the variation of absorption with pressure is expressed graphically. Each curve is known as absorption isotherm for a particular temperature. Plotting the graph with reference to equation 3.
log mx Vs log p
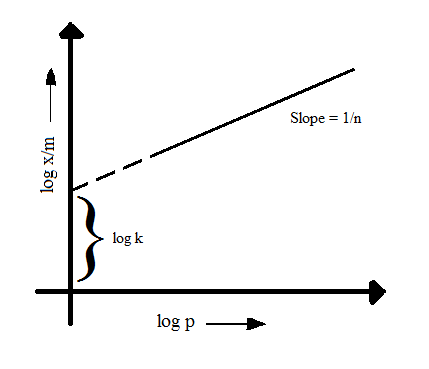
Slope = n1
Intercept = log K
Thus, option D is the correct.
Note:
The Freundlich adsorption isotherm equation is purely an empirical.It is very important to remember the Freundlich adsorption isotherm equation. The equation 2 to be converted to log form first then, the graph to be plotted as mentioned in question. With reference to equation 3 the graph is drawn.