Question
Question: For an ideal monoatomic gas, match the following graphs for constant mass in different process. | ...
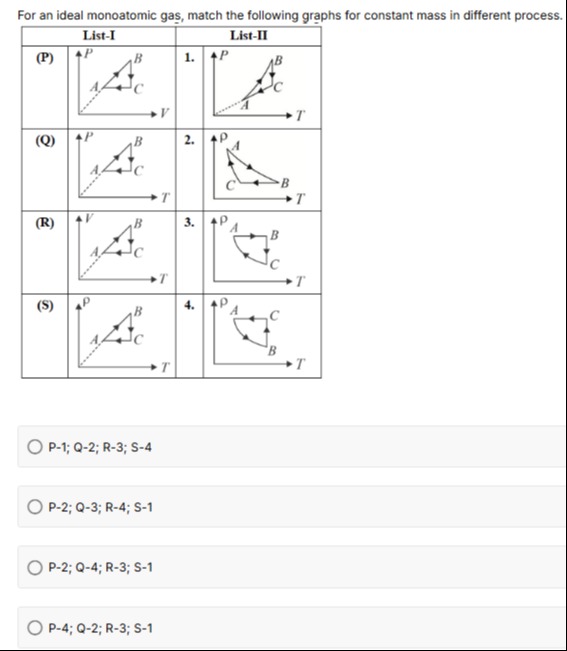
For an ideal monoatomic gas, match the following graphs for constant mass in different process.
| List-I | List-II | ||
|---|---|---|---|
| (P) | 1. | ||
| (Q) | 2. | ||
| (R) | 3. | ||
| (S) | 4. |
P-1; Q-2; R-3; S-4
P-2; Q-3; R-4; S-1
P-2; Q-4; R-3; S-1
P-4; Q-2; R-3; S-1
P–1; Q–2; R–3; S–4 (option 1)
Solution
We can “translate” the process‐curves from one pair of variables to another using the ideal‐gas law
PV=nRT⟹T=nRPV,or, equivalently,
P=VnRT\mboxandρ=Vm.Thus a process given as a pressure–volume curve will appear different when the state–variable pair is changed. In the problem one is given a closed (triangular) cycle represented in four different “pictures” (with different variables) so that if the process is “translated” using the state–equation the “shape” of a given segment may become “curved” or “straight” in the new variables.
A short outline of the reasoning is as follows:
-
Among the four curves in List–I the one labeled (Q) is already plotted as “P versus T”. Its description (“two straight‐line segments and one curved”) exactly matches that of graph “2” in List–II. Hence
Q→2. -
The curve labeled (S) in List–I is drawn as “density (ρ) versus T”. In List–II only the graph labeled “4” is of the same variables. Hence
S→4. -
The curve labeled (R) is “V versus T” with the straight‐line portions and a dashed line from the origin. When one “translates” (R) to the P–T plane using P=nRT/V the two segments which were originally straight become “curved” (because V is a linear function of T) and only one segment remains a straight line; this matches the description of graph “3” in List–II. Thus
R→3. -
Finally the (P) curve in List–I is “P versus V” where one segment is curved and the other two are straight. On converting via T=PV/(nR) one obtains a P–T representation that comes out as in graph “1” of List–II (with a dashed line from the origin as a “marker” of the transformation). Thus
P→1.
Thus the overall matching is
P–1; Q–2; R–3; S–4.
Among the given choices the correct answer is:
- P–1; Q–2; R–3; S–4
Explanation (minimal):
- The process (Q) is already P–T with two straight segments and one curved – it exactly matches graph 2.
- The (S) curve is a ρ–T graph; the only graph with those variables is 4.
- Transforming the (R) V–T cycle (with two straight parts) to P–T by P=nRT/V gives one straight segment (A–B) and two curved parts, which is graph 3.
- Finally, (P) is the P–V cycle; its conversion using T=PV/(nR) leads to the appearance of graph 1.