Question
Question: Following graph shows the correct variation in intensity of heat radiations by black body and freque...
Following graph shows the correct variation in intensity of heat radiations by black body and frequency at a fixed temperature
A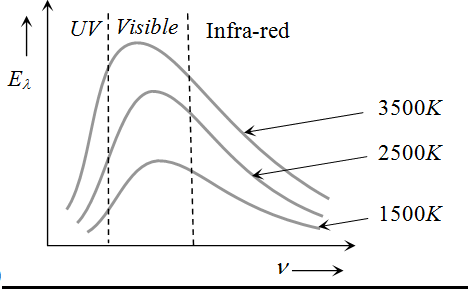
B
C
D
Answer
Explanation
Solution
As the temperature of body increases, frequency corresponding to maximum energy in radiation (vm) increases this is shown in graph (3).