Question
Question: Find the median value from the given table by drawing the curve of the values. Weight (In kgs.)|...
Find the median value from the given table by drawing the curve of the values.
| Weight (In kgs.) | No. of students |
|---|---|
| Less than 38 | 0 |
| Less than 40 | 3 |
| Less than 42 | 5 |
| Less than 44 | 9 |
| Less than 46 | 14 |
| Less than 48 | 28 |
| Less than 50 | 32 |
| Less than 52 | 35 |
Solution
We will plot a cumulative frequency curve for the given distribution also called an ogive and then find the median using the graph.
Complete step-by-step solution:
From the question we know the cumulative frequency of the distribution. Since the last cumulative frequency is 35 the given sample has the weight of total 35 students.
Now, we have to plot the graph with taking the upper limit of weight on X-axis and the respective cumulative frequency on the Y-axis to get the less than ogive.
The points to be plotted to make a less than ogive are on the graph are: (38,0),(40,3),(42,5),(44,9),(46,14),(48,28),(50,32),(52,35)
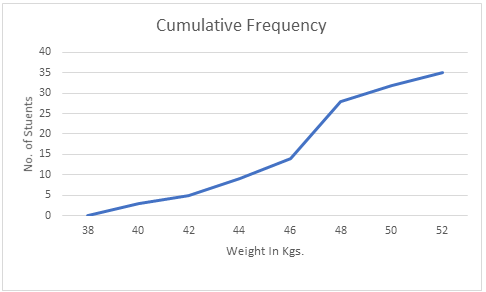
The Curve in the above graph is the Cumulative Frequency Curve i.e. the ogive.
Now to find the median:
Let N be the total number of students whose data is given.
Also, N will be the cumulative frequency of the last interval.
We find the [2N]th item and mark it on the y-axis.
In this case the [2N]th item is (35/2) = 17.5 student.
We draw a perpendicular from 17.5 to the right to cut the Ogive curve.
From where the Ogive curve is cut, draw a perpendicular on the x-axis. The point at which it touches the x-axis will be the median value of the series as shown in the graph:
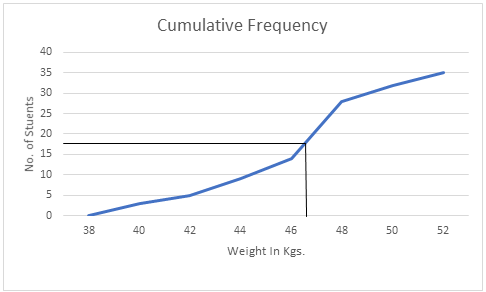
∴ From the above Graph we can see that the median is almost 47 which is the required answer.
Note: The cumulative frequency should always be plotted on the Y-axis to get a correct ogive.
This was an example of a less than ogive, there also exists a more than ogive, in this type of ogive while making the cumulative frequency table, all the succeeding terms in the distribution should be added to a term in the table.