Question
Question: Find the area of region \(\left\\{ {\left( {x,y} \right) \in {R^2}:y \geqslant \sqrt {\left| {x + 3}...
Find the area of region \left\\{ {\left( {x,y} \right) \in {R^2}:y \geqslant \sqrt {\left| {x + 3} \right|} ,5y \leqslant x + 9 \leqslant 15} \right\\}.
A) 61
B) 34
C) 23
D) 35
Solution
Use the given equations to plot the curves on the coordinate plane. And use the inequality to find the region belonging to inequality. Plot y⩾∣x+3∣ , 5y⩽x+9 and x⩽6 separately. In case of y⩾∣x+3∣, simplify it by squaring both sides and resolve the absolute value function for the interval x⩽−3 and x⩾−3. Now figure out the region and use the method of integration to find the area under the curve.
Complete step by step answer:
We are here given with three inequalities that represent three different regions on the Cartesian plane. The three inequalities are y⩾∣x+3∣ , 5y⩽x+9 and x+9⩽15. We need to find the area of the region which is bounded by these curves.
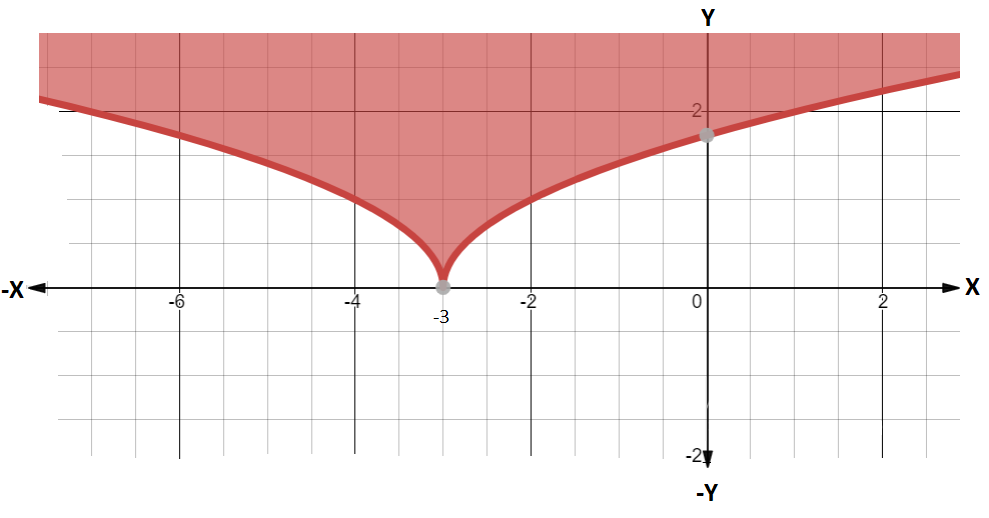
Let us find these regions one by one. First, consider the inequality: y⩾∣x+3∣
We can transform this into a more useful form by squaring both sides:
⇒y2⩾∣x+3∣
Now, we need to resolve this absolute function on the right-hand side. But first, we need to understand the concept of the absolute value function. The definition of this function is as follows:
f\left( x \right) = \left| x \right| = \left\\{ {\begin{array}{*{20}{c}}
{x,{\text{ if }}x \geqslant 0} \\\
{ - x,{\text{ if }}x < 0}
\end{array}} \right.
So, using this definition, we can write that:
\Rightarrow {y^2} \geqslant \left\\{ {\begin{array}{*{20}{c}}
{x + 3,{\text{ when }}\left( {x + 3} \right) \geqslant 0 \Rightarrow x \geqslant - 3} \\\
{ - 3 - x,{\text{ when }}\left( {x + 3} \right) \leqslant 0 \Rightarrow x \leqslant - 3{\text{ }}}
\end{array}} \right.
Thus, for x⩾−3 the curve will be a parabola that opens towards the direction of the positive x-axis and for x⩽−3 the curve will be a parabola that opens towards the negative x-axis. This is because of the sign of the variable x in the equation.
Therefore, we can now draw our curve. But first, we need to consider some details from the parent equation. Since y was greater than equal to a square root, therefore the value of y can never be negative.
As we know, the curve will divide the x-y plane into two-part. So, for checking the region to be selected, we need to perform a test by assuming a point which is not on the curve.
Let’s take (x,y)=(0,0) and put in the inequality and check if it holds.
⇒y⩾∣x+3∣⇒0⩾∣0+3∣⇒0⩾3
So, this point does not satisfy the inequality. Thus we can say this point will not lie in the region represented by this inequality.
And as we know that the equation of the parabola is of the form y2=4ax , therefore, this parabola can be represented by this following figure:
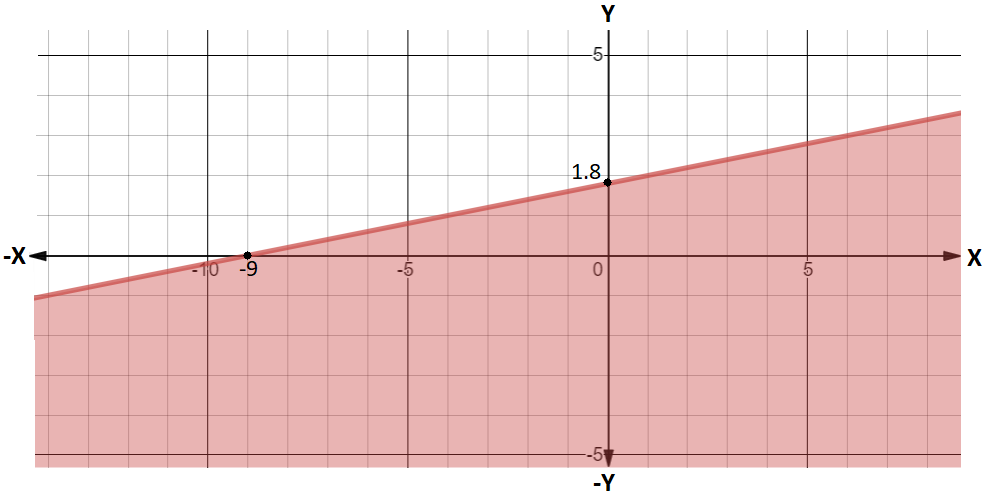
Similarly, let us now consider the inequality 5y⩽x+9⩽15
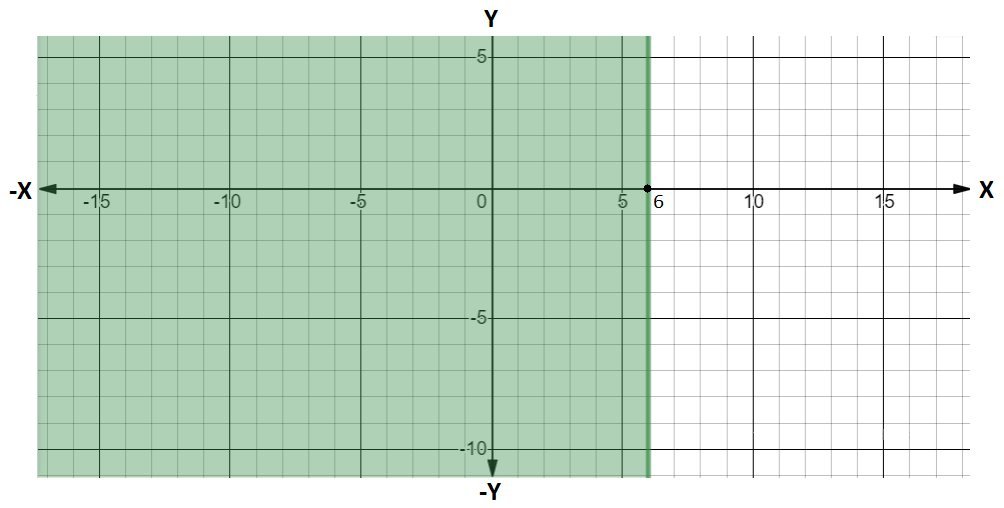
Or this inequality can be represented in a simpler form as: 5y⩽x+9 and x+9⩽15⇒5y−x−9⩽0 and x⩽6
This gives us two equations of the line. Let’s consider 5y−x−9⩽0 first and try to find the intercept points on x-axis and y-axis. For x-intercept, we can put y=0 and for y-intercept, we can put x=0
⇒ At y=0 , x+9=0⇒x=−9 and at x=0, 5y−9=0⇒y=59
And the line x⩽6 will be vertical and pass parallel to the y-axis through point (6,0).
Now, for checking the region, we put (0,0) in 5y−x−9⩽0: ⇒0−0−9⩽0⇒−9⩽0
So, the coordinates of origin satisfy the equation and the origin will be inside the region.
So, now we can plot these lines easily as shown in the diagram:
Now, we can combine these three regions to find the bounded area and the coordinates for the intersection point. Thus the required region is shown in the following figure:
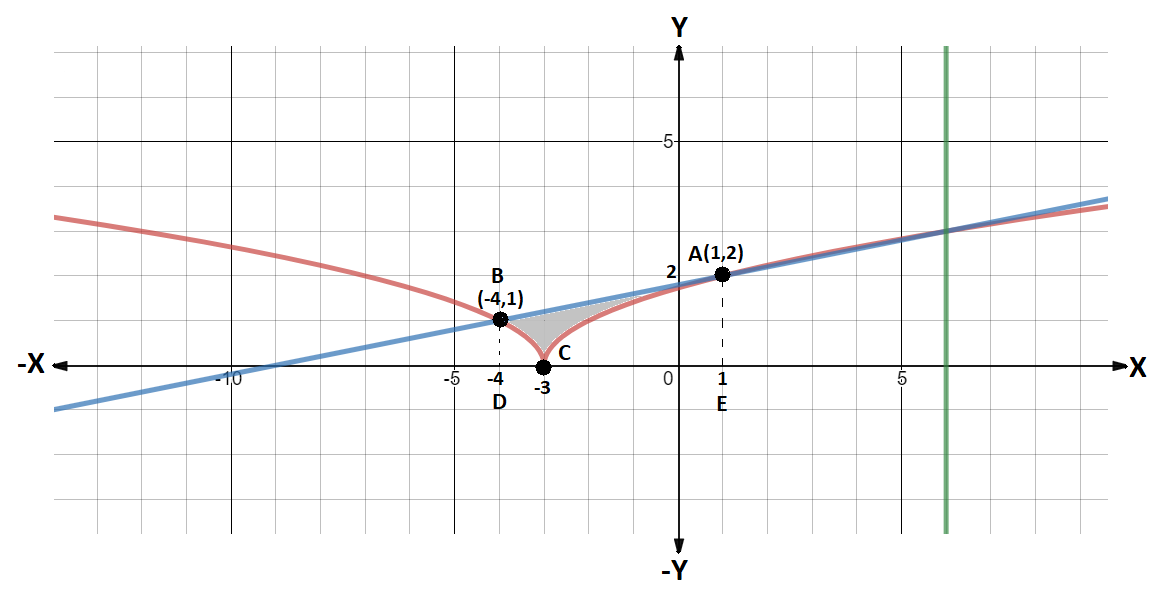
So, we got the region ABC as the required bounded area. The points of intersection of line 5y−x−9=0 and parabola y=∣x+3∣ are A and B.
Let’s now try to figure out these points. For point A, x>−3 therefore, the equation of parabola will be y2=x+3. So we have to find a common point of y2=x+3 and 5y−x−9=0. This can be done substituting the value of x from first into the second equation.
⇒5y−(y2−3)−9=0⇒y2−5y+6=0⇒(y−2)(y−3)=0
Therefore, y=2 or y=3
But for y=2⇒x=y2−3=4−3⇒x=1 and for y=3⇒x=32−3=6
They intersect at (1,2) and (6,3) but (1,2)lie before (6,3). Thus coordinates of point A is (1,2).
Now, for the second point B, the equation of parabola for x<\-3 will become y2=−3−x .
Similarly, we need to find the intersection point of y2=−3−x and 5y−x−9=0. We can do this by substituting the value of x from first into the second equation.
⇒5y−(−y2−3)−9=0⇒y2+5y−6=0⇒(y−1)(y+6)=0
Therefore, y=1 or y=−6
But for y=1⇒x=−y2−3=−1−3⇒x=−4 and for y=−6⇒x=−y2−3=−36−3=−39
They intersect at (−4,1) and (−39,−4) but the value of y cannot be negative. So coordinates of point B is (−4,1).
If we notice the diagram carefully, we can see that if we drop a line perpendicular to points A and B on the x-axis we get a trapezium ABDE. And our bounded region ABC falls completely inside this trapezium.
⇒ Area of trapezium ABDE = Area of the bounded region ABC + Area of the parabola in interval (−4,−3) + Area of the parabola in the interval (−3,1)
We know that the area of under the curve and x-axis can be found through integrating the equation with respect to x in a definite interval.
Therefore, the area of the parabola in the interval (−4,−3)will be −4∫−3−3−xdx and the area of the parabola in the interval (−3,1) will be represented by −3∫1x+3dx
From the above relation, we get that:
⇒ Required Area= Area of trapezium ABDE−−4∫−3−3−xdx −−3∫1x+3dx
These both integrals can be solved using ∫xndx=n+1xn+1+C and the area of trapezium can be expressed as half times the sum of parallel sides times the distance between them.
Therefore, we get:
⇒ Required Area= 21×(BD+AE)×DE −−23(−3−x)23−4−3 −23(x+3)23−31
Now let’s put the values of BD, AE and DE from the diagram. On solving further, we have:
⇒ Required Area= 21×(1+2)×5 +32(−3+3)23−(−3+4)23 −32(1+3)23−(−3+3)23
This can be further simplified as:
⇒ Required Area= 215 +32[0−1] −32[8−0] =215−32−316=215−318=23sq.units
Therefore, we got the area of the required region as 23sq.units.
Hence, the option (C) is the correct answer.
Note: Always draw a diagram when you are asked to find the area of the bounded region using some equation of curves. Notice than while plotting the curve y=∣x+3∣ we made some transformations by squaring both sides and then resolving the absolute value function. This will always help in drawing the curve on the coordinate plane but never forget to check the range and domain with the parent equation, i.e. y=∣x+3∣.