Question
Question: Figures (a) and (b) refer to the steady flow of a (non-viscous) liquid. Which of the two figures is ...
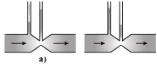
Figures (a) and (b) refer to the steady flow of a (non-viscous) liquid. Which of the two figures is incorrect? Why?
Solution
First recall the definition of the equation of continuity then we find that the velocity of liquid flow at a constriction of tube is more than the other portion of tube. Then using Bernoulli's Theorem it shows that the equation is constant.
Complete step by step answer:
Here,
From the definition of the equation of continuity, we know that,in physics, a continuity equation is an equation that describes the transportation of a certain volume. When applied to a conserved quantity it is especially simple and strong, but it can be generalized to apply to any large quantity.
So,according to the equation of continuity, i.e., av=Constant, where area of cross-section of tube is less, the velocity of liquid flow is more.
So the velocity of liquid flow at a constriction of tube is more than the other portion of tube.
Therefore,according to Bernoulli's Theorem,
P+21ρv2= Constant
Where v is more, ρ is less and vice versa.
Hence, the figure (a) is incorrect.
Note: In physics, a continuity equation is an equation that describes the transportation of a certain volume. When applied to a conserved quantity it is especially simple and strong, but it can be generalized to apply to any large quantity.